the conditional relative frequency table was calculated by row using data from a survey of one stations…
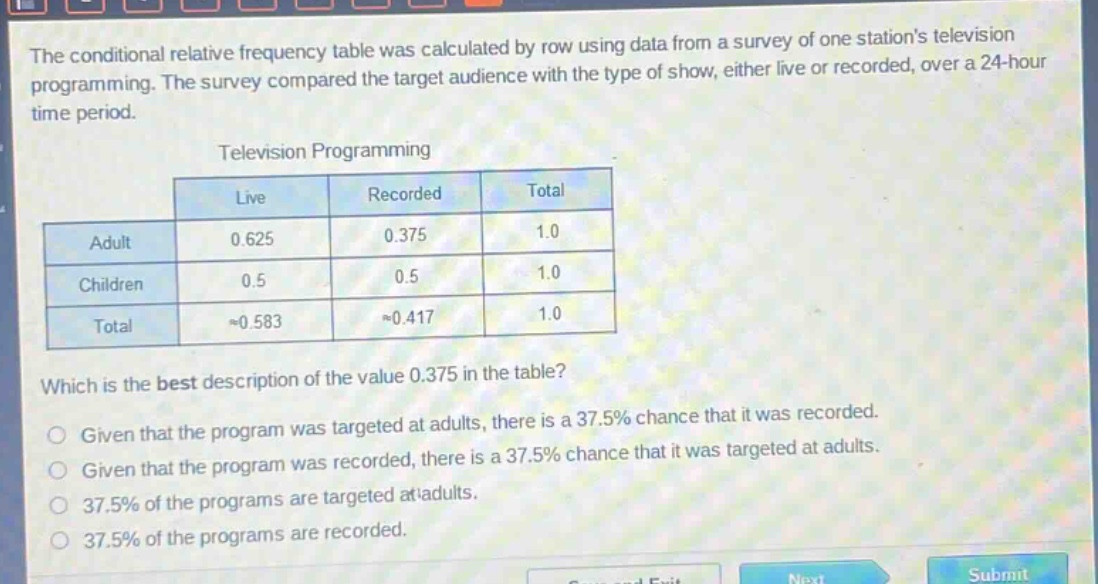
the conditional relative frequency table was calculated by row using data from a survey of one stations television programming. the survey compared the target audience with the type of show, either live or recorded, over a 24 - hour time period.\ntelevision programming\n| | live | recorded | total |\n|--|--|--|--| \n| adult | 0.625 | 0.375 | 1.0 |\n| children | 0.5 | 0.5 | 1.0 |\n| total | ≈0.583 | ≈0.417 | 1.0 |\nwhich is the best description of the value 0.375 in the table?\ngiven that the program was targeted at adults, there is a 37.5% chance that it was recorded.\ngiven that the program was recorded, there is a 37.5% chance that it was targeted at adults.\n37.5% of the programs are targeted at adults.\n37.5% of the programs are recorded.
Answer
Brief Explanations:
The table is a conditional - relative frequency table calculated by row. The value 0.375 is in the "Adult" row and "Recorded" column. This means, among the programs targeted at adults, the proportion of recorded programs is 0.375 or 37.5%.
Answer:
Given that the program was targeted at adults, there is a 37.5% chance that it was recorded.