the conditional relative frequency table below was generated by column from a frequency table comparing the…
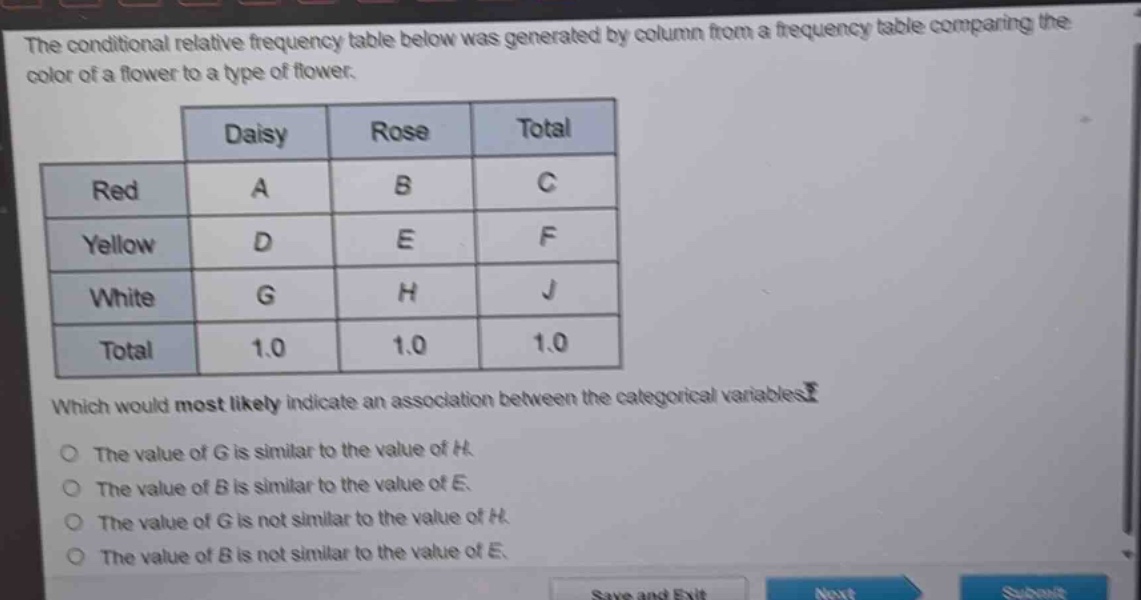
the conditional relative frequency table below was generated by column from a frequency table comparing the color of a flower to a type of flower.\n| |daisy|rose|total|\n|--|--|--|--|\n|red|a|b|c|\n|yellow|d|e|f|\n|white|g|h|j|\n|total|1.0|1.0|1.0|\nwhich would most likely indicate an association between the categorical variables?\nthe value of g is similar to the value of h.\nthe value of b is similar to the value of e.\nthe value of g is not similar to the value of h.\nthe value of b is not similar to the value of e.
Answer
Answer:
The value of G is not similar to the value of H.
Explanation:
Step1: Understand conditional relative frequency
Conditional relative frequency compares the frequency of a category within a subgroup.
Step2: Association concept
An association between categorical variables exists when the conditional - relative frequencies are different.
Step3: Analyze options
If G (conditional relative frequency of white - daisy) is not similar to H (conditional relative frequency of white - rose), it indicates an association between flower color and flower type. If they were similar, it would suggest no association in terms of the white - colored flowers for daisies and roses.