the conditional relative - frequency table below was generated by column from a frequency table comparing…
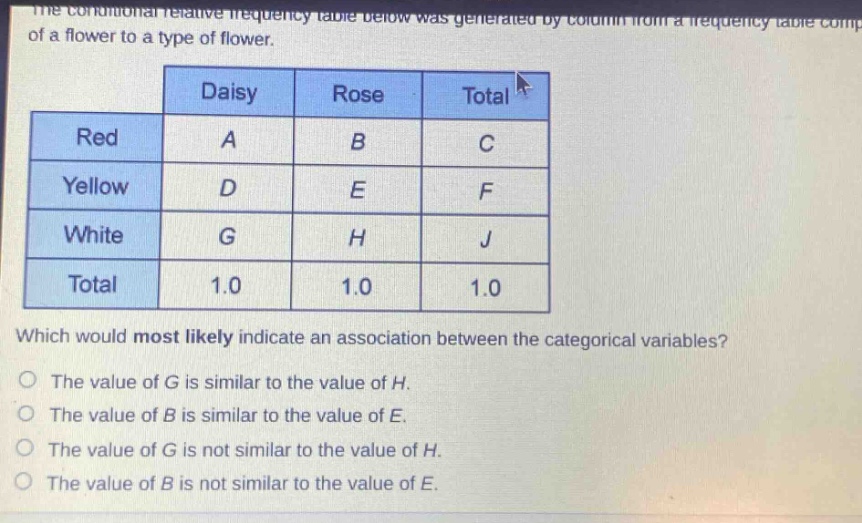
the conditional relative - frequency table below was generated by column from a frequency table comparing the color of a flower to a type of flower.\n| |daisy|rose|total|\n|--|--|--|--|\n|red|a|b|c|\n|yellow|d|e|f|\n|white|g|h|j|\n|total|1.0|1.0|1.0|\nwhich would most likely indicate an association between the categorical variables?\nthe value of g is similar to the value of h.\nthe value of b is similar to the value of e.\nthe value of g is not similar to the value of h.\nthe value of b is not similar to the value of e.
Answer
Answer:
The value of G is not similar to the value of H.
Explanation:
Step1: Understand association in categorical variables
In a contingency - relative frequency table, if there is an association between categorical variables (in this case, color of flower and type of flower), the relative frequencies within the categories should differ.
Step2: Analyze the options
If the value of G (relative frequency of white daisies) is not similar to the value of H (relative frequency of white roses), it indicates that the color white is not evenly distributed between daisies and roses. This non - similarity in relative frequencies for a particular color across the two types of flowers is an indication of an association between the color of the flower and the type of flower. If the values were similar, it would suggest no association as the distribution of the color would be the same for both types of flowers. Similarly, for options related to B and E, they do not give as strong an indication of association as the comparison of G and H for the same color across different flower types.