the conditional relative frequency table below was generated by column using data comparing gender and a…
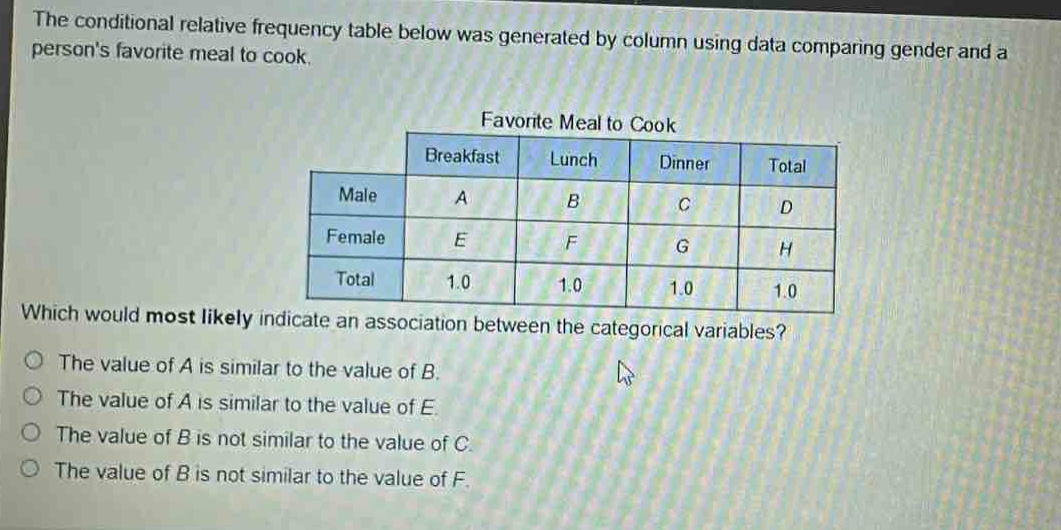
the conditional relative frequency table below was generated by column using data comparing gender and a persons favorite meal to cook.\nwhich would most likely indicate an association between the categorical variables?\nthe value of a is similar to the value of b.\nthe value of a is similar to the value of e.\nthe value of b is not similar to the value of c.\nthe value of b is not similar to the value of f.
Answer
Explanation:
Step1: Understand conditional relative - frequency
Conditional relative - frequency is used to see if there is an association between two categorical variables. If there is no association, the conditional relative frequencies for each category of one variable within the levels of the other variable should be similar.
Step2: Analyze the options
In a conditional relative - frequency table comparing gender and favorite meal to cook, if there is an association between gender and favorite meal, the conditional relative frequencies for males and females for the same meal type should be different. For example, if the proportion of males who prefer lunch ($B$) is very different from the proportion of females who prefer lunch ($F$), it indicates an association between gender and favorite meal to cook.
Answer:
The value of $B$ is not similar to the value of $F$.