the conditional relative frequency table below was generated by column using frequency table data comparing…
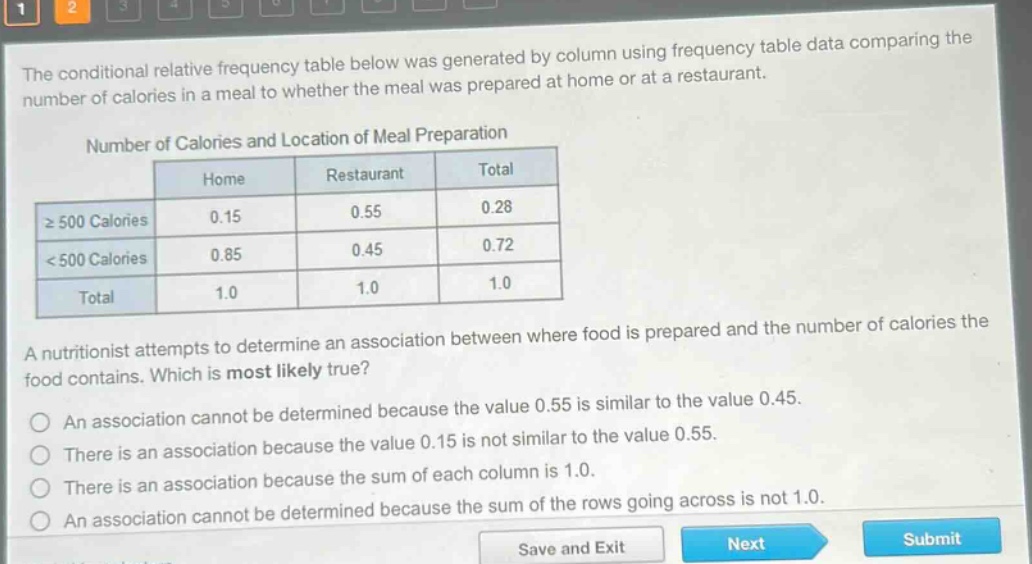
the conditional relative frequency table below was generated by column using frequency table data comparing the number of calories in a meal to whether the meal was prepared at home or at a restaurant. number of calories and location of meal preparation home restaurant total ≥ 500 calories 0.15 0.55 0.28 < 500 calories 0.85 0.45 0.72 total 1.0 1.0 1.0 a nutritionist attempts to determine an association between where food is prepared and the number of calories the food contains. which is most likely true? an association cannot be determined because the value 0.55 is similar to the value 0.45. there is an association because the value 0.15 is not similar to the value 0.55. there is an association because the sum of each column is 1.0. an association cannot be determined because the sum of the rows going across is not 1.0.
Answer
Explanation:
Step1: Understand conditional relative - frequency
Conditional relative - frequency is used to look for associations in two - way tables. If the conditional relative frequencies for different categories are significantly different, there is an association.
Step2: Analyze the given table
For meals prepared at home, the conditional relative frequency of having ≥ 500 calories is 0.15, and for meals prepared at a restaurant, it is 0.55. These values are quite different.
Step3: Evaluate each option
- Option 1: 0.55 and 0.45 are not the key values to compare for association. The comparison should be between 0.15 and 0.55.
- Option 2: Since 0.15 (home, ≥ 500 calories) is not similar to 0.55 (restaurant, ≥ 500 calories), there is an association. This is correct.
- Option 3: The sum of each column being 1.0 is a property of conditional relative - frequency tables and does not indicate association.
- Option 4: The sum of rows not being 1.0 is not relevant to determining association.
Answer:
There is an association because the value 0.15 is not similar to the value 0.55.