the conditional relative frequency table was generated by row using frequency table data comparing the hat…
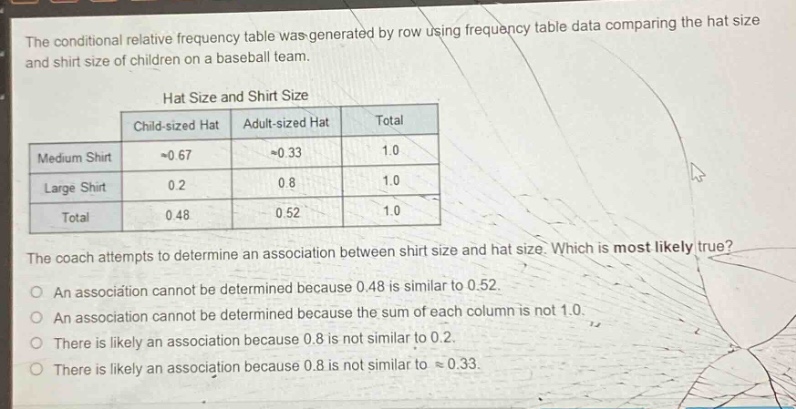
the conditional relative frequency table was generated by row using frequency table data comparing the hat size and shirt size of children on a baseball team.\n\nhat size and shirt size\n| |child - sized hat|adult - sized hat|total|\n|--|--|--|--|\n|medium shirt|≈0.67|≈0.33|1.0|\n|large shirt|0.2|0.8|1.0|\n|total|0.48|0.52|1.0|\n\nthe coach attempts to determine an association between shirt size and hat size. which is most likely true?\no an association cannot be determined because 0.48 is similar to 0.52.\no an association cannot be determined because the sum of each column is not 1.0.\no there is likely an association because 0.8 is not similar to 0.2.\no there is likely an association because 0.8 is not similar to ≈0.33.
Answer
Explanation:
Step1: Understand conditional relative - frequency
Conditional relative - frequency helps in determining relationships between two variables. If the conditional relative frequencies for different categories of one variable are very different for different categories of the other variable, there is likely an association.
Step2: Analyze the given table
For large - sized shirts, the conditional relative frequency of having an adult - sized hat is 0.8, and for medium - sized shirts, the conditional relative frequency of having an adult - sized hat is approximately 0.33. These two values (0.8 and 0.33) are quite different.
Step3: Make a conclusion
A large difference in conditional relative frequencies indicates a likely association between shirt size and hat size.
Answer:
There is likely an association because 0.8 is not similar to ≈0.33.