the conditional relative frequency table was generated using data that compared a students grade level and…
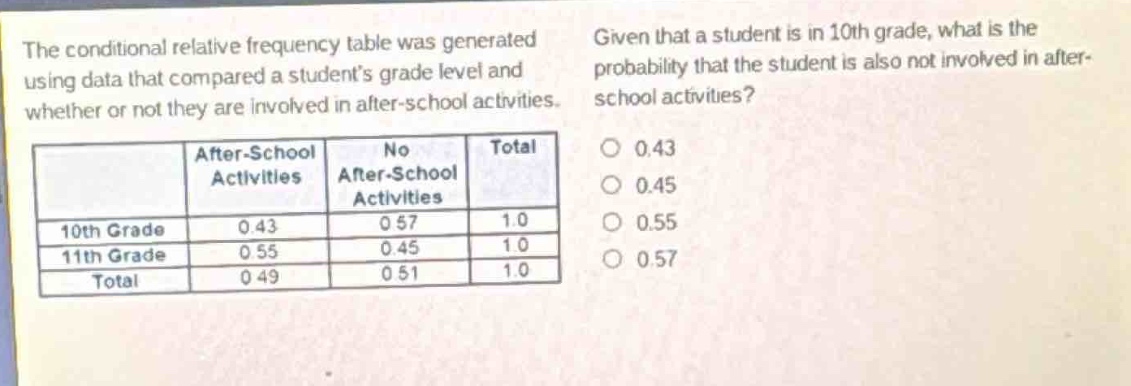
the conditional relative frequency table was generated using data that compared a students grade level and whether or not they are involved in after - school activities. given that a student is in 10th grade, what is the probability that the student is also not involved in after - school activities?\n| |after - school activities|no after - school activities|total|\n|----|----|----|----|\n|10th grade|0.43|0.57|1.0|\n|11th grade|0.55|0.45|1.0|\n|total|0.49|0.51|1.0|\n0.43\n0.45\n0.55\n0.57
Answer
Answer:
0.57
Explanation:
Step1: Identify relevant row
Look at 10th - grade row.
Step2: Find probability value
Value for no after - school activities is 0.57.