the conditional relative frequency table was generated using data that compares the favorite subjects of…
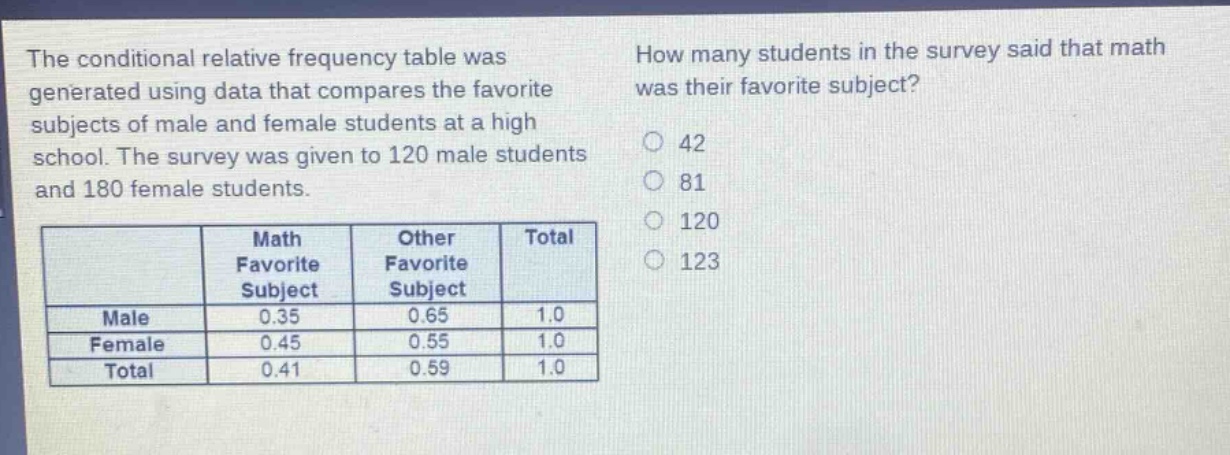
the conditional relative frequency table was generated using data that compares the favorite subjects of male and female students at a high school. the survey was given to 120 male students and 180 female students.\n| | math favorite subject | other favorite subject | total |\n|--|--|--|--|\n| male | 0.35 | 0.65 | 1.0 |\n| female | 0.45 | 0.55 | 1.0 |\n| total | 0.41 | 0.59 | 1.0 |\nhow many students in the survey said that math was their favorite subject?\n42\n81\n120\n123
Answer
Explanation:
Step1: Calculate number of male students who like math
Number of male students is 120. Proportion of male students who like math is 0.35. So number of male students who like math is $120\times0.35 = 42$.
Step2: Calculate number of female students who like math
Number of female students is 180. Proportion of female students who like math is 0.45. So number of female students who like math is $180\times0.45=81$.
Step3: Calculate total number of students who like math
Add the number of male and female students who like math. $42 + 81=123$.
Answer:
123