consider the data set shown on the graph.\nwhat point should be removed from the data set to have the graph…
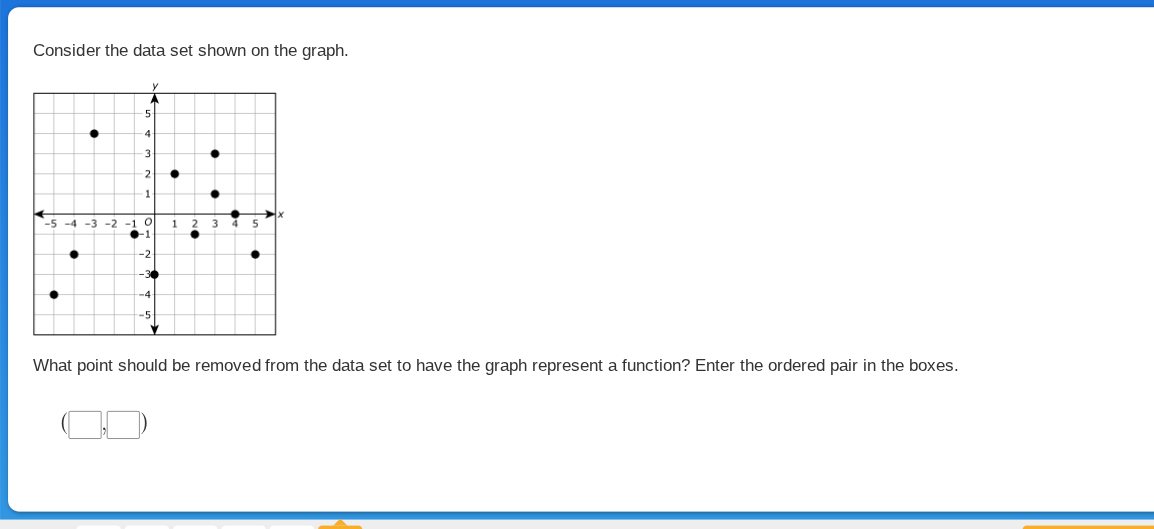
consider the data set shown on the graph.\nwhat point should be removed from the data set to have the graph represent a function? enter the ordered pair in the boxes.\n(□,□)
Answer
Explanation:
Step1: Recall function definition
A function requires each input ($x$-value) to map to exactly one output ($y$-value).
Step2: Identify duplicate x-values
Check all points: $(-5,-4), (-4,-1), (-3,4), (-1,-1), (0,2), (0,-2), (1,1), (2,-1), (3,3), (4,0), (4,-2)$. The $x$-value $x=0$ has two $y$-values: $2$ and $-2$; $x=4$ has two $y$-values: $0$ and $-2$.
Step3: Select removable point
Either $(0,-2)$ or $(0,2)$, or $(4,0)$ or $(4,-2)$ can be removed. The most straightforward choice is one of the duplicate pairs, e.g., $(0,-2)$.
Answer:
$(0,-2)$ Note: $(0,2)$, $(4,0)$, or $(4,-2)$ are also valid correct answers.