consider the data shown below. 6, 8, 0, 2, 2, 8, 7, 8, 4, 8, 6, 3, 8, 2, 0, 8, 2, 3, 8 which measure of…
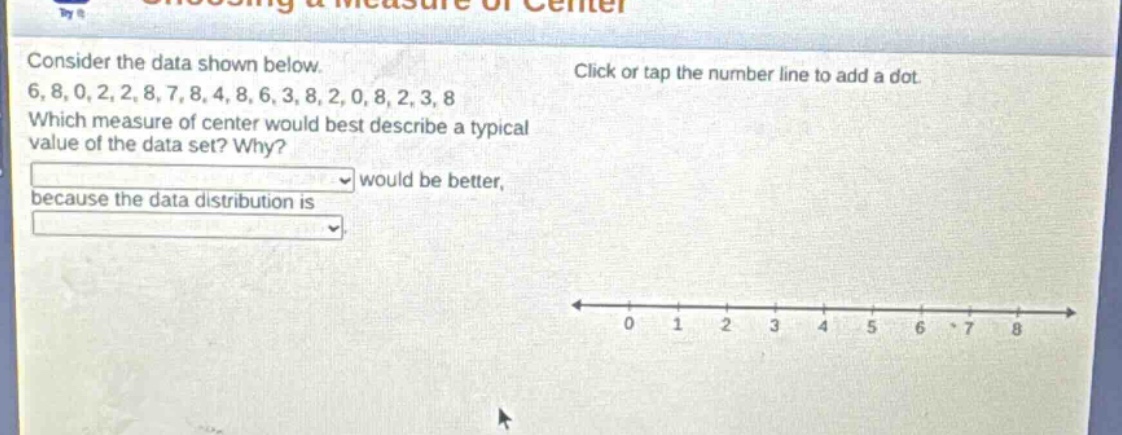
consider the data shown below. 6, 8, 0, 2, 2, 8, 7, 8, 4, 8, 6, 3, 8, 2, 0, 8, 2, 3, 8 which measure of center would best describe a typical value of the data set? why? would be better, because the data distribution is
Answer
Explanation:
Step1: Analyze the data
The data set is 6, 8, 0, 2, 2, 8, 7, 8, 4, 8, 6, 3, 8, 2, 0, 8, 2, 3, 8. We can see that the number 8 appears frequently.
Step2: Recall measure - center concepts
The main measures of center are mean, median, and mode. Mean is the sum of all data divided by the number of data points. Median is the middle - value when data is ordered. Mode is the most frequently occurring value.
Step3: Determine the best measure
Since the data has a value (8) that occurs very frequently and there may be an impact of extreme values (0) on the mean, the mode would be a better measure of center. The data distribution is skewed (due to the frequent 8s and the presence of 0s), and the mode is not affected by extreme values as much as the mean.
Answer:
Mode; skewed