consider the data shown below.\n6, 8, 0, 2, 2, 8, 7, 8, 4, 8, 6, 3, 8, 2, 0, 8, 2, 3, 8\nwhich measure of…
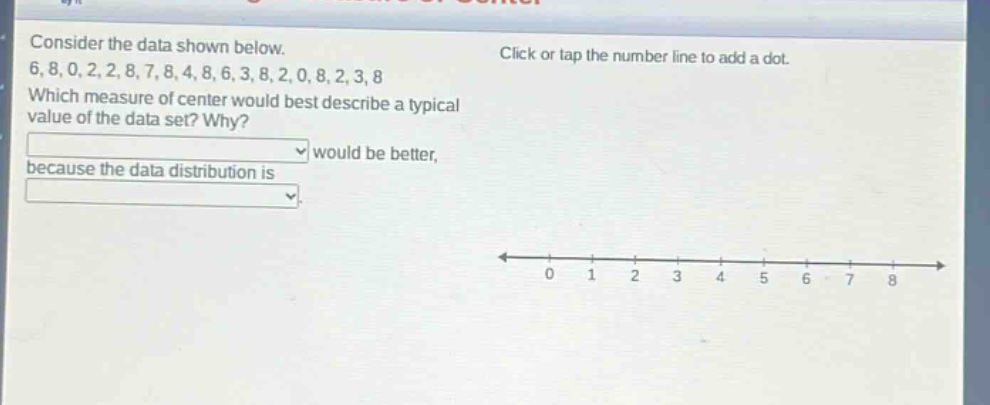
consider the data shown below.\n6, 8, 0, 2, 2, 8, 7, 8, 4, 8, 6, 3, 8, 2, 0, 8, 2, 3, 8\nwhich measure of center would best describe a typical value of the data set? why?\nwould be better,\nbecause the data distribution is
Answer
Explanation:
Step1: Organize the data
First, organize the data set (6,8,0,2,2,8,7,8,4,8,6,3,8,2,0,8,2,3,8) in ascending - order: (0,0,2,2,2,2,3,3,4,6,6,7,8,8,8,8,8,8,8).
Step2: Analyze the data distribution
Count the frequency of each value. The value (8) appears (7) times, which is much more frequently than other values. So, the data distribution is skewed.
Step3: Select the measure of center
For skewed data, the median is a better measure of center than the mean because the mean can be affected by extreme values (in this case, the high - frequency of (8)).
Answer:
Median; skewed