consider the plot that was created from the residuals of a line of best fit for a set of data. does the…
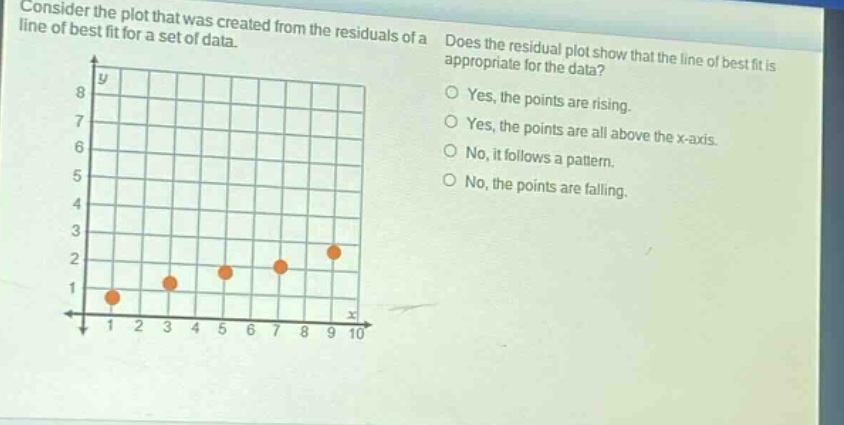
consider the plot that was created from the residuals of a line of best fit for a set of data. does the residual plot show that the line of best fit is appropriate for the data? yes, the points are rising. yes, the points are all above the x - axis. no, it follows a pattern. no, the points are falling.
Answer
Explanation:
Step1: Recall residual - plot criteria
For a line of best fit to be appropriate, the residuals should be randomly scattered.
Step2: Analyze the given plot
The points in the given residual plot follow a pattern (they are evenly spaced and seem to have a non - random distribution).
Answer:
No, it follows a pattern.