consider the table showing the given, predicted, and residual values for a data - set. which point would be…
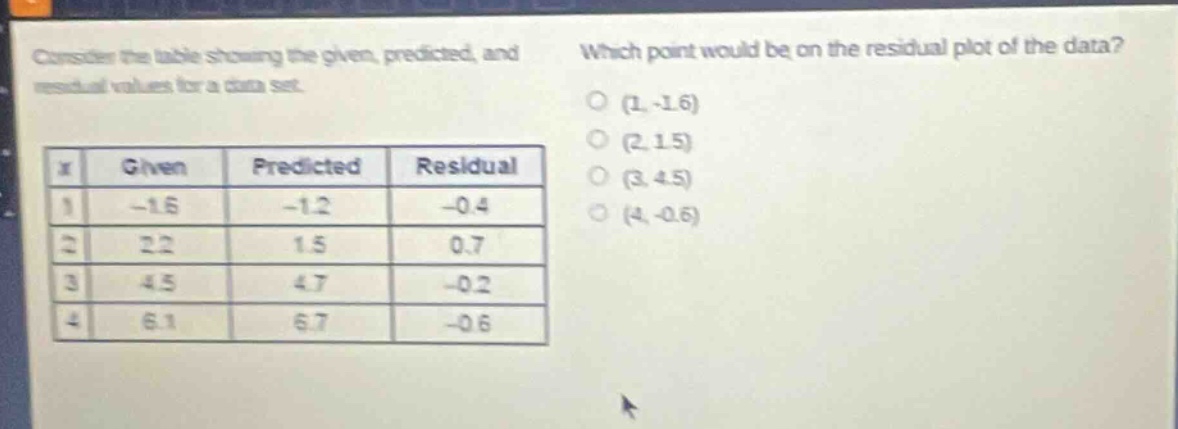
consider the table showing the given, predicted, and residual values for a data - set. which point would be on the residual plot of the data?\n|x|given|predicted|residual|\n|----|----|----|----|\n|1|-1.6|-1.2|-0.4|\n|2|2.2|1.5|0.7|\n|3|4.5|4.7|-0.2|\n|4|6.1|6.7|-0.6|\n(1, - 1.6)\n(2, 1.5)\n(3, 4.5)\n(4, - 0.6)
Answer
Answer:
D. (4, -0.6)
Explanation:
Step1: Recall residual plot concept
A point on residual plot is (x, residual).
Step2: Check each option
For x = 1, residual is -0.4 not -1.6. For x = 2, residual is 0.7 not 1.5. For x = 3, residual is -0.2 not 4.5. For x = 4, residual is -0.6 which matches option D.