containers of gochujang, a korean chili sauce, are sold at a market. the scatter plot shows the relationship…
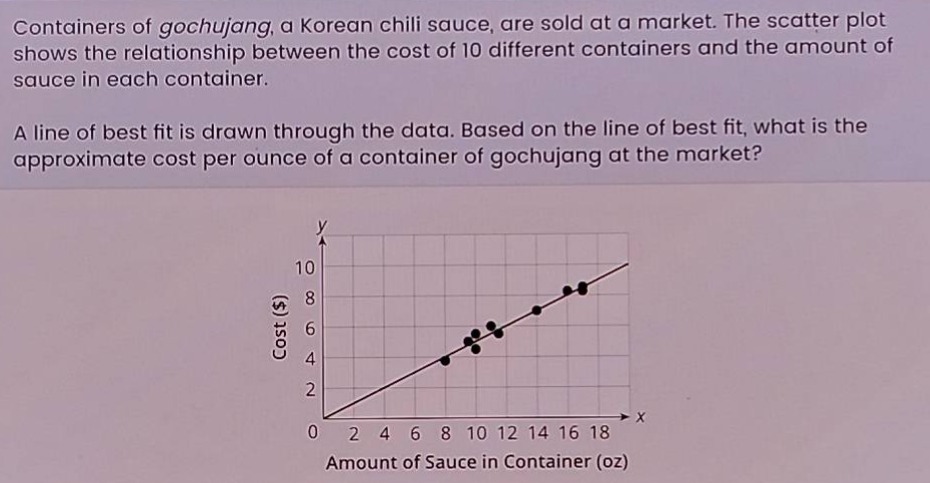
containers of gochujang, a korean chili sauce, are sold at a market. the scatter plot shows the relationship between the cost of 10 different containers and the amount of sauce in each container. a line of best fit is drawn through the data. based on the line of best fit, what is the approximate cost per ounce of a container of gochujang at the market?
Answer
Explanation:
Step1: Recall slope formula
The cost - per - ounce is the slope of the line of best fit. The slope formula is $m=\frac{y_2 - y_1}{x_2 - x_1}$.
Step2: Select two points on the line
Let's choose two points on the line of best fit. For example, we can take $(6,4)$ and $(18,8)$.
Step3: Calculate the slope
$m=\frac{8 - 4}{18 - 6}=\frac{4}{12}=\frac{1}{3}\approx0.33$.
Answer:
Approximately $$0.33$ per ounce.