the coordinate points below show part of the data collected by the cell phone company, where x is age in…
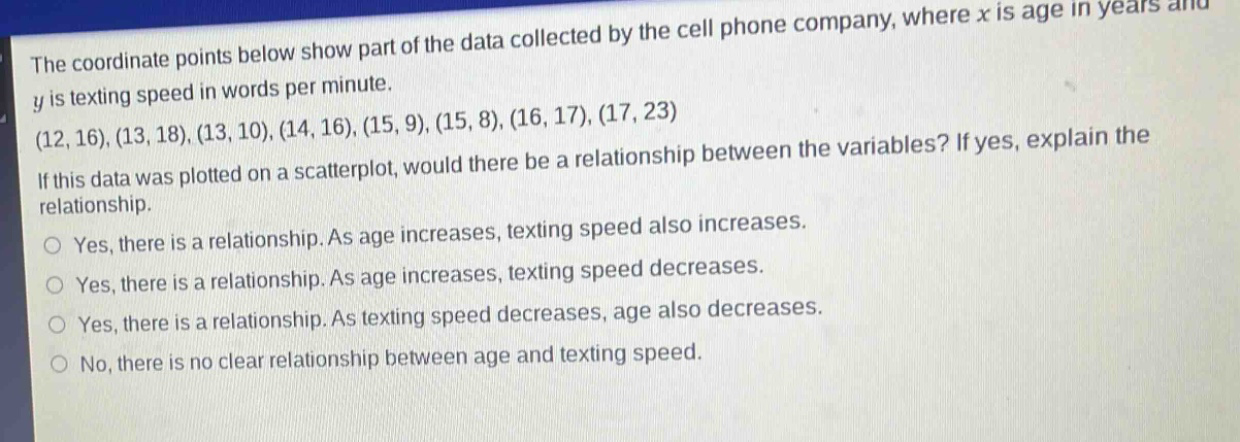
the coordinate points below show part of the data collected by the cell phone company, where x is age in years and y is texting speed in words per minute. (12,16),(13,18),(13,10),(14,16),(15,9),(15,8),(16,17),(17,23) if this data was plotted on a scatterplot, would there be a relationship between the variables? if yes, explain the relationship. yes, there is a relationship. as age increases, texting speed also increases. yes, there is a relationship. as age increases, texting speed decreases. yes, there is a relationship. as texting speed decreases, age also decreases. no, there is no clear relationship between age and texting speed.
Answer
Brief Explanations:
Examine the data points. Ages are 12, 13, 13, 14, 15, 15, 16, 17 and corresponding texting - speeds are 16, 18, 10, 16, 9, 8, 17, 23. There is no consistent pattern where as age increases, texting speed either increases or decreases.
Answer:
No, there is no clear relationship between age and texting speed.