cora got a new pedometer. it keeps track of how many steps she walks each day.\nsteps walked\n7,773 8,454…
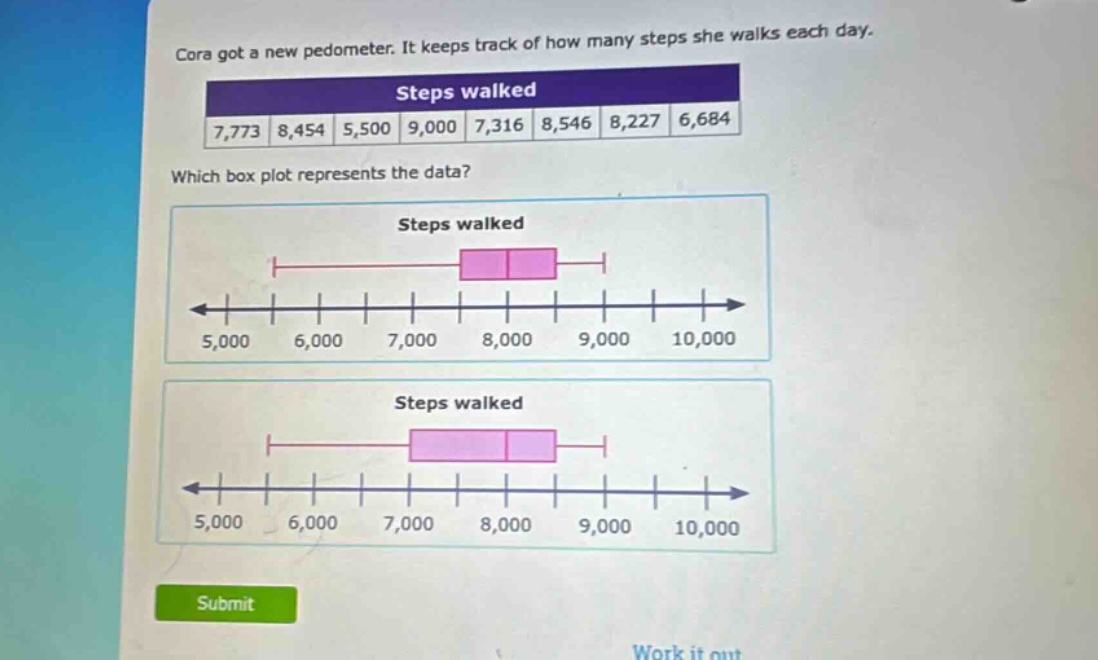
cora got a new pedometer. it keeps track of how many steps she walks each day.\nsteps walked\n7,773 8,454 5,500 9,000 7,316 8,546 8,227 6,684\nwhich box plot represents the data?\nsteps walked\nsteps walked
Answer
Explanation:
Step1: Arrange data in ascending order
$5500,6684,7316,7773,8227,8454,8546,9000$
Step2: Find the median (Q2)
Since there are 8 data - points, the median is the average of the 4th and 5th values. $\text{Q2}=\frac{7773 + 8227}{2}=8000$
Step3: Find the lower half of data
The lower half is $5500,6684,7316,7773$. The median of the lower half (Q1) is $\frac{6684+7316}{2}=7000$
Step4: Find the upper half of data
The upper half is $8227,8454,8546,9000$. The median of the upper half (Q3) is $\frac{8454 + 8546}{2}=8500$
Step5: Identify the minimum and maximum
The minimum value is $5500$ and the maximum value is $9000$
The box - plot should have the minimum at $5500$, Q1 at $7000$, Q2 at $8000$, Q3 at $8500$, and the maximum at $9000$. Based on these values, we can match the correct box - plot.
Answer:
Without seeing the full set of box - plot options, we can't give a specific choice. But the correct box - plot should have a box starting at 7000, ending at 8500, with a line inside the box at 8000, and whiskers extending to 5500 and 9000.