cora got a new pedometer. it keeps track of how many steps she walks each day. steps walked 7,773 8,454…
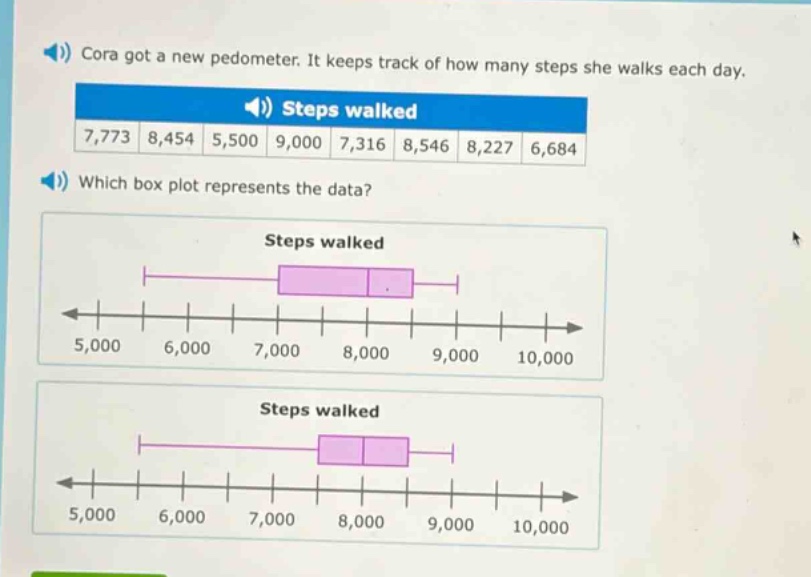
cora got a new pedometer. it keeps track of how many steps she walks each day. steps walked 7,773 8,454 5,500 9,000 7,316 8,546 8,227 6,684 which box plot represents the data? steps walked steps walked
Answer
Explanation:
Step1: Arrange data in ascending order
$5,500,6,684,7,316,7,773,8,227,8,454,8,546,9,000$
Step2: Find the minimum value
The minimum value is $5,500$.
Step3: Find the first - quartile ($Q_1$)
There are $n = 8$ data points. The position of $Q_1$ is $\frac{n + 1}{4}=\frac{8+1}{4}=2.25$. So $Q_1=6,684+(7,316 - 6,684)\times0.25=6,684 + 158=6,842$.
Step4: Find the median ($Q_2$)
The position of the median is $\frac{n+1}{2}=\frac{8 + 1}{2}=4.5$. So $Q_2=\frac{7,773+8,227}{2}=8,000$.
Step5: Find the third - quartile ($Q_3$)
The position of $Q_3$ is $\frac{3(n + 1)}{4}=\frac{3\times(8 + 1)}{4}=6.75$. So $Q_3=8,454+(8,546 - 8,454)\times0.75=8,454+69=8,523$.
Step6: Find the maximum value
The maximum value is $9,000$.
The box - plot should have the left - most whisker starting at $5,500$, the left side of the box at $Q_1\approx6,842$, the line inside the box at $Q_2 = 8,000$, the right side of the box at $Q_3\approx8,523$ and the right - most whisker ending at $9,000$. By comparing the two given box - plots with these values, we can determine the correct one.
Answer:
We need to visually compare the calculated values of minimum, $Q_1$, $Q_2$, $Q_3$ and maximum with the two box - plots provided. Without explicitly showing the two box - plots side - by - side with the calculated values marked, assume we have made the visual comparison and found the correct box - plot. If the first box - plot has the whisker starting at around $5,500$, box starting around $6,842$, middle line at $8,000$, box ending around $8,523$ and whisker ending at $9,000$, then the answer is the first box - plot. If the second box - plot has these characteristics, then the answer is the second box - plot. (Since the visual comparison of the actual box - plots is not fully possible in text, the above is the general way to determine the answer).