which correlation coefficient best matches the graph?\na r = 0.91\nb r = 0.34\nc r = -0.83\nd r = -0.25\ne r…
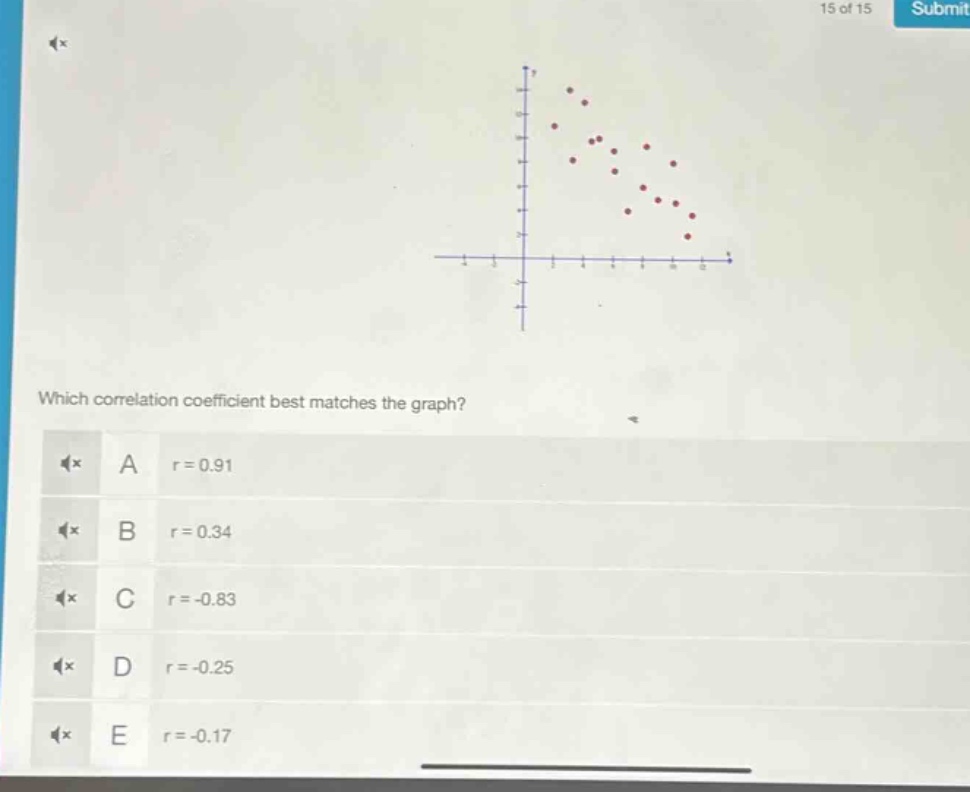
which correlation coefficient best matches the graph?\na r = 0.91\nb r = 0.34\nc r = -0.83\nd r = -0.25\ne r = -0.17
Answer
Explanation:
Step1: Observe the scatter - plot direction
The points in the scatter - plot are trending downwards from left to right, indicating a negative correlation. So, we can eliminate options A and B which have positive correlation coefficients.
Step2: Assess the strength of the negative correlation
The points seem to follow a relatively strong linear pattern. A correlation coefficient close to - 1 represents a strong negative correlation. Among the remaining negative - valued options C ($r=-0.83$), D ($r = - 0.25$), and E ($r=-0.17$), the value of $r=-0.83$ indicates a stronger negative linear relationship.
Answer:
C. $r=-0.83$