what is the correlation coefficient for the data shown in the table?\n1\n-1\n5\n10
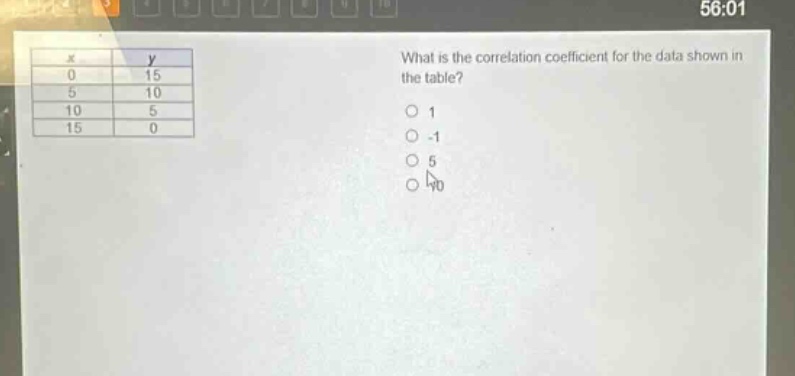
what is the correlation coefficient for the data shown in the table?\n1\n-1\n5\n10
Answer
Explanation:
Step1: Recall correlation coefficient concept
The correlation coefficient $r$ measures the strength and direction of a linear relationship. A perfect negative - linear relationship has $r=- 1$, a perfect positive - linear relationship has $r = 1$, and no linear relationship has $r = 0$.
Step2: Analyze the data
As $x$ increases from $0$ to $15$, $y$ decreases from $15$ to $0$. The relationship between $x$ and $y$ is a perfect negative - linear relationship. For example, when $x$ changes from $0$ to $5$, $y$ changes from $15$ to $10$; when $x$ changes from $5$ to $10$, $y$ changes from $10$ to $5$.
Answer:
-1