correlation coefficient\n\nquestion\ndetermine the type of correlation represented in the scatter plot below.
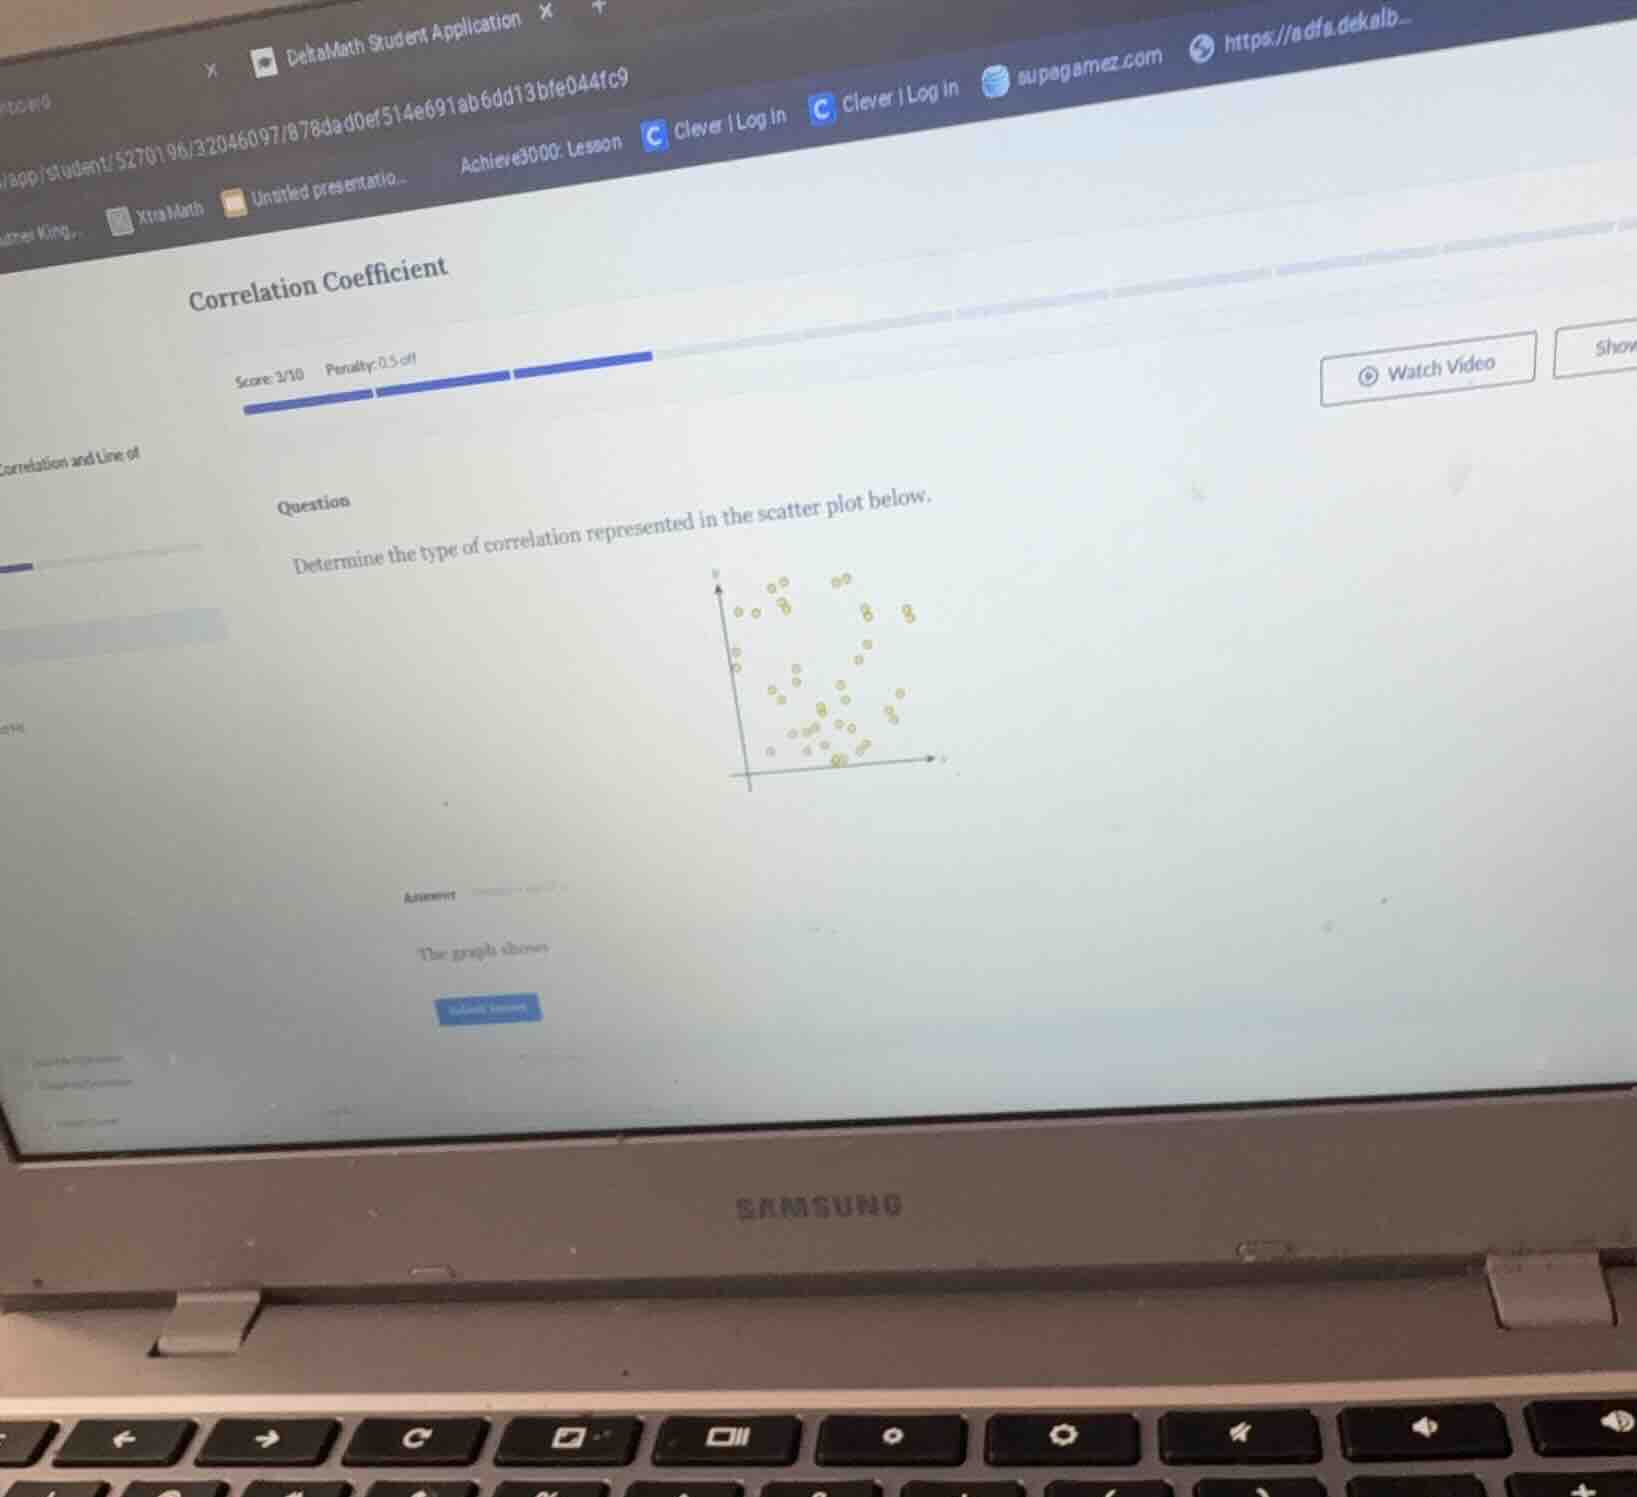
correlation coefficient\n\nquestion\ndetermine the type of correlation represented in the scatter plot below.
Answer
Explanation:
Step1: Analyze the distribution of data points
Observe the scatter plot to see if the points follow a specific linear or non-linear trend.
Step2: Check for directional trends
Determine if the $y$-values consistently increase (positive) or decrease (negative) as $x$-values increase.
Step3: Identify the correlation type
The points are scattered randomly across the graph without forming a clear line or curve, indicating no relationship between the variables.
Answer:
no correlation