cost per doctor visit\nhow might the graph be redrawn to emphasize the difference between the cost per…
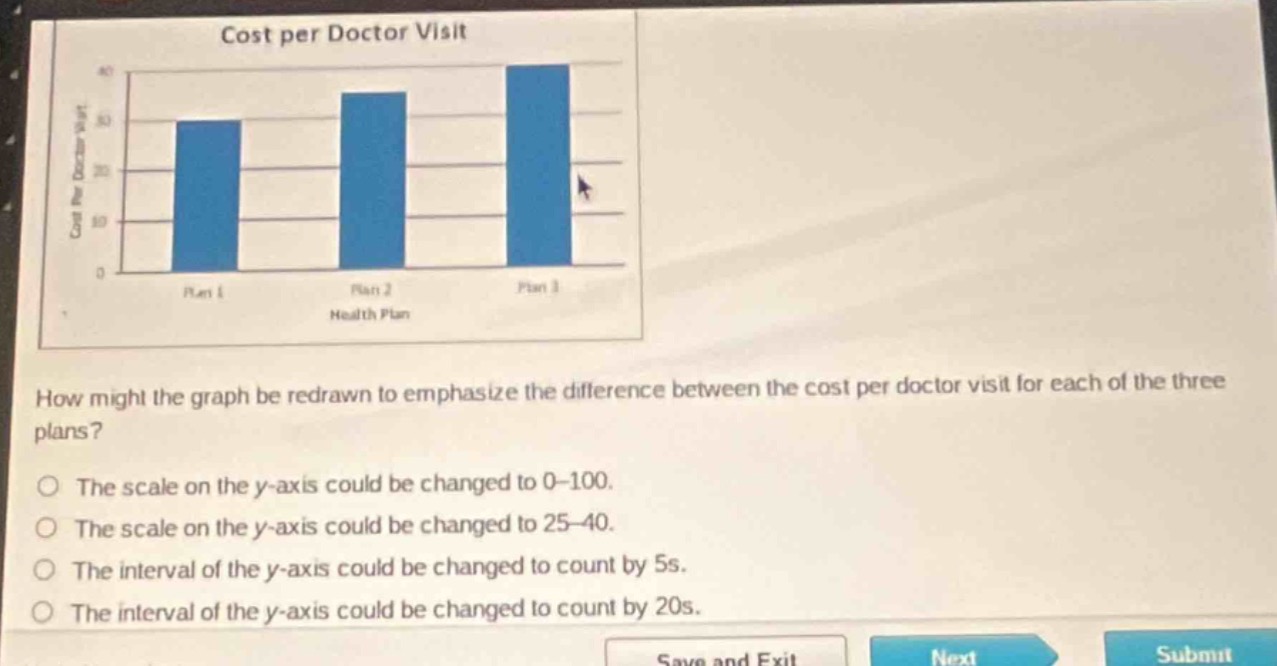
cost per doctor visit\nhow might the graph be redrawn to emphasize the difference between the cost per doctor visit for each of the three plans?\nthe scale on the y - axis could be changed to 0–100.\nthe scale on the y - axis could be changed to 25–40.\nthe interval of the y - axis could be changed to count by 5s.\nthe interval of the y - axis could be changed to count by 20s.
Answer
Brief Explanations:
Changing the y - axis scale to 25 - 40 would make the differences between the bar heights more pronounced as the range is narrower compared to other options. A wider range like 0 - 100 or larger intervals (counting by 20s) would compress the visual differences. Counting by 5s doesn't specifically emphasize the differences as effectively as narrowing the range.
Answer:
The scale on the y - axis could be changed to 25 - 40.