cost per event\nwhy is the graph misleading?\nthe x - axis scale shows the data is more clustered than it…
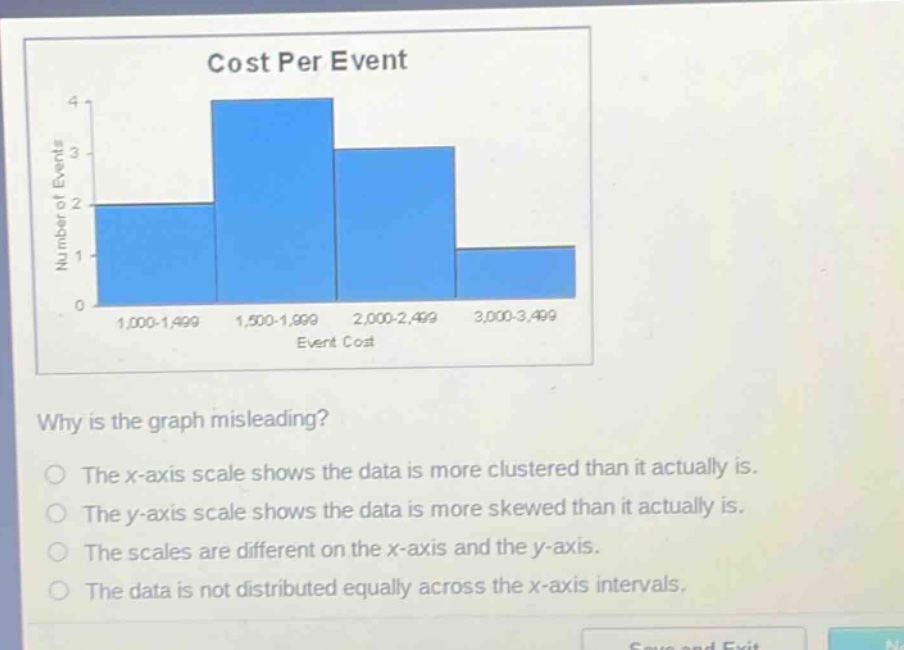
cost per event\nwhy is the graph misleading?\nthe x - axis scale shows the data is more clustered than it actually is.\nthe y - axis scale shows the data is more skewed than it actually is.\nthe scales are different on the x - axis and the y - axis.\nthe data is not distributed equally across the x - axis intervals.
Answer
Brief Explanations:
The x - axis scale makes the data seem more clustered. The intervals on the x - axis are not evenly spaced, which can give a false impression of how the data is grouped.
Answer:
The x - axis scale shows the data is more clustered than it actually is.