the cougars basketball team sold tins of flavored popcorn as a fundraiser. the players competed for prizes…
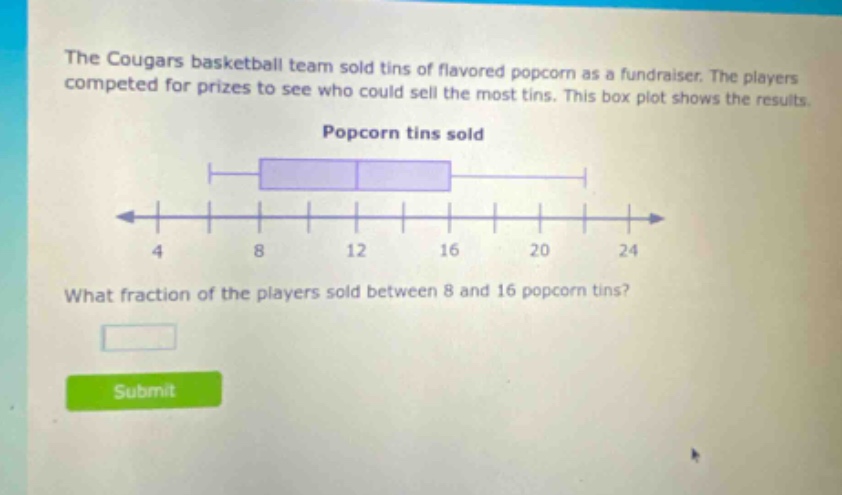
the cougars basketball team sold tins of flavored popcorn as a fundraiser. the players competed for prizes to see who could sell the most tins. this box plot shows the results. popcorn tins sold what fraction of the players sold between 8 and 16 popcorn tins?
Answer
Explanation:
Step1: Understand box - plot quartiles
In a box - plot, the box represents the middle 50% (or $\frac{1}{2}$) of the data. The lower end of the box is the first quartile ($Q_1$) and the upper end is the third quartile ($Q_3$). Here, $Q_1 = 8$ and $Q_3=16$.
Answer:
$\frac{1}{2}$