craig wondered how his sleep affects his quiz scores. he kept track of how much sleep he got the night…
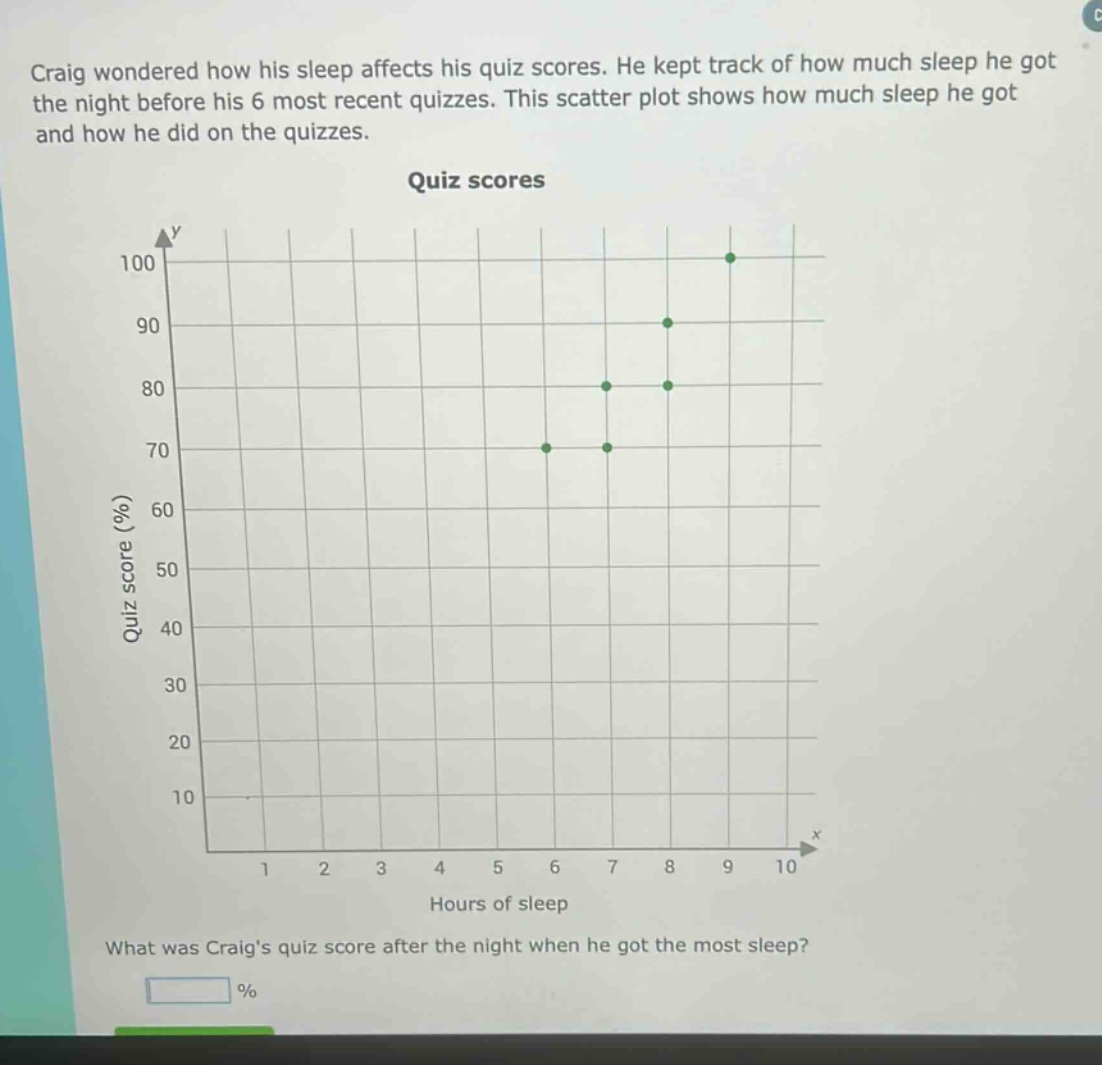
craig wondered how his sleep affects his quiz scores. he kept track of how much sleep he got the night before his 6 most recent quizzes. this scatter plot shows how much sleep he got and how he did on the quizzes. quiz scores what was craigs quiz score after the night when he got the most sleep? %
Answer
Explanation:
Step1: Locate max sleep on x - axis
The x - axis represents hours of sleep. The maximum value of x in the scatter - plot is 9 hours.
Step2: Find corresponding y - value
We look at the point on the scatter - plot with x = 9. The corresponding y - value (quiz score) for x = 9 is 100.
Answer:
100