creating a box plot for real - world data\nthe number of bus riders was recorded on one route. the data have…
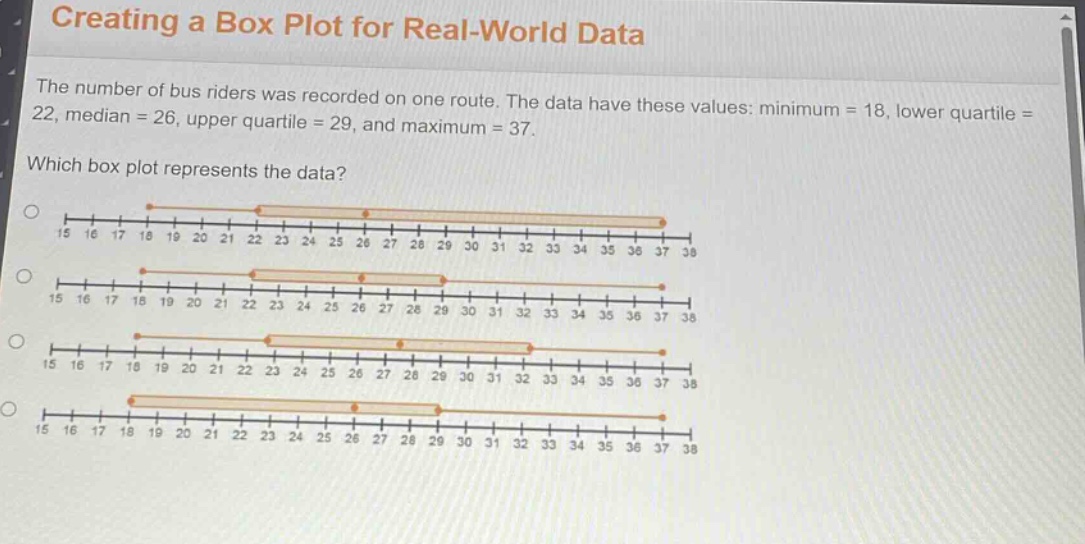
creating a box plot for real - world data\nthe number of bus riders was recorded on one route. the data have these values: minimum = 18, lower quartile = 22, median = 26, upper quartile = 29, and maximum = 37.\nwhich box plot represents the data?
Answer
Explanation:
Step1: Identify box - plot components
A box - plot has a line at the minimum value, the start of the box at the lower quartile, a line inside the box at the median, the end of the box at the upper quartile, and a line at the maximum value.
Step2: Check minimum value
The minimum value is 18. We need to find a box - plot where the left - most whisker ends at 18.
Step3: Check lower quartile
The lower quartile is 22. The left - hand side of the box should be at 22.
Step4: Check median
The median is 26. The line inside the box should be at 26.
Step5: Check upper quartile
The upper quartile is 29. The right - hand side of the box should be at 29.
Step6: Check maximum value
The maximum value is 37. The right - most whisker should end at 37.
Answer:
The box - plot where the left - most whisker ends at 18, the left - hand side of the box is at 22, the line inside the box is at 26, the right - hand side of the box is at 29, and the right - most whisker ends at 37. (Since no option identifiers are given, a description is provided. If there were option identifiers like A, B, C, D, we would identify the correct one among them based on the above criteria).