creating a scatterplot\n1. label axes according to input/output.\n is the x - axis label.\n is the y - axis…
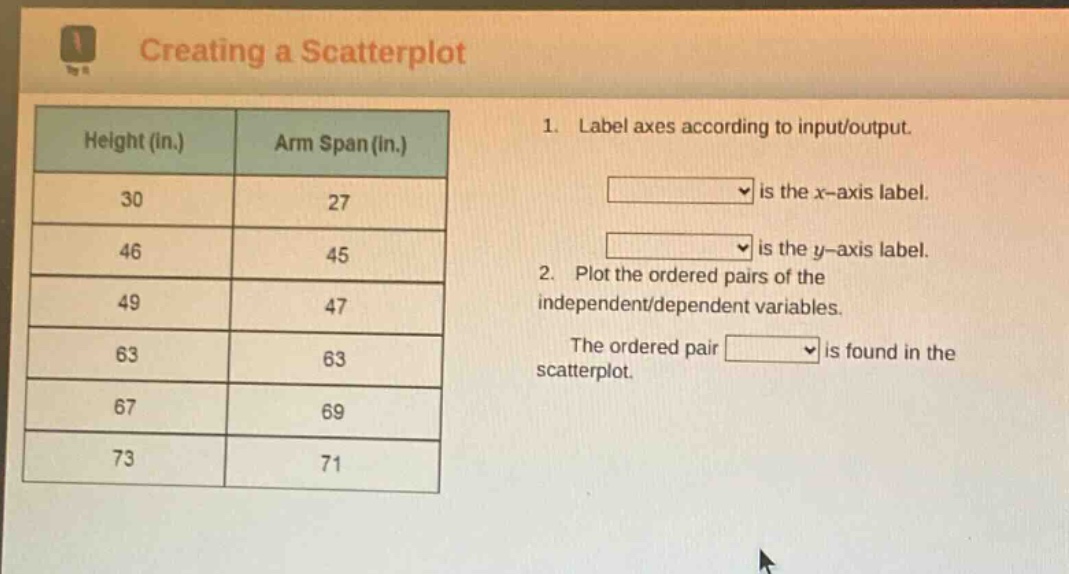
creating a scatterplot\n1. label axes according to input/output.\n is the x - axis label.\n is the y - axis label.\n2. plot the ordered pairs of the independent/dependent variables.\nthe ordered pair is found in the scatterplot.\nheight (in.)\tarm span (in.)\n30\t27\n46\t45\n49\t47\n63\t63\n67\t69\n73\t71
Answer
Explanation:
Step1: Identify independent and dependent variables
Typically, height can be considered the independent variable (input) and arm - span the dependent variable (output). So height is on the x - axis and arm span is on the y - axis.
Step2: Recall ordered pair format
An ordered pair is in the form (x, y). For example, when height (x) = 30 and arm - span (y)=27, the ordered pair is (30, 27).
Answer:
- Height (in.) is the x - axis label. Arm Span (in.) is the y - axis label.
- The ordered pair (30, 27) is found in the scatterplot. (You could also choose other ordered pairs from the table like (46, 45), (49, 47) etc.)