the creekview history museum kept track of how many people visited the museum each day last month. this box…
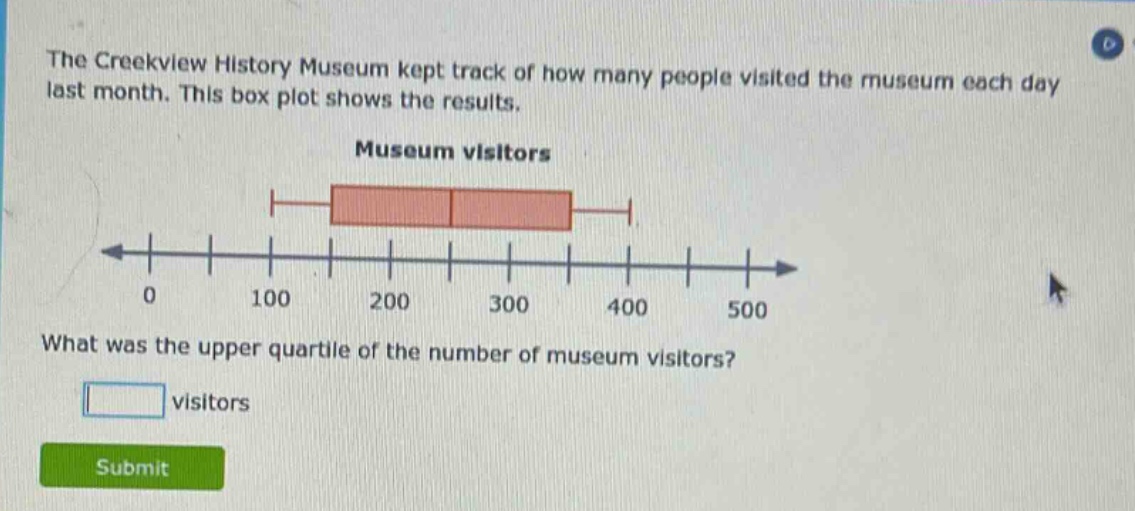
the creekview history museum kept track of how many people visited the museum each day last month. this box plot shows the results. museum visitors what was the upper quartile of the number of museum visitors? visitors submit
Answer
Explanation:
Step1: Recall box - plot properties
In a box - plot, the right - hand edge of the box represents the upper quartile ($Q_3$).
Step2: Identify the value
Looking at the box - plot, the right - hand edge of the box is at 400.
Answer:
400