cresap bay tide table\n| date | time | low/high tide |\n| :--- | :--- | :--- |\n| thursday, feb. 7 | 1:26…
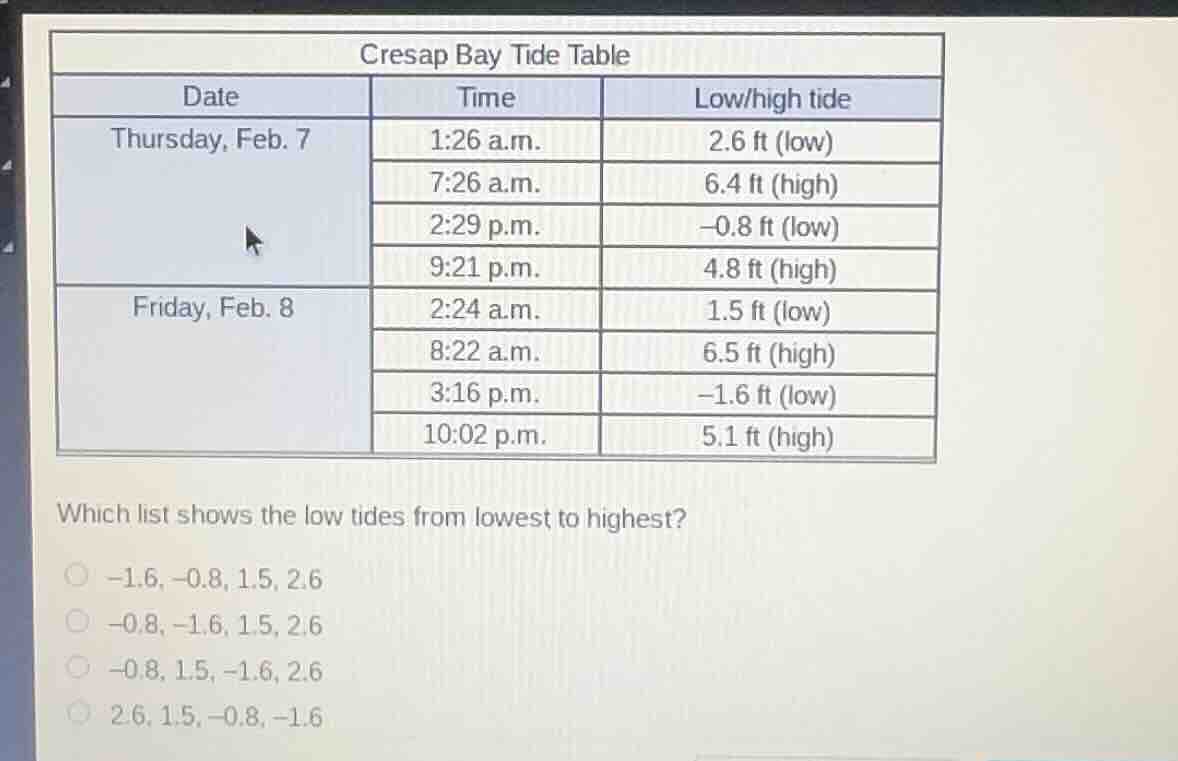
cresap bay tide table\n| date | time | low/high tide |\n| :--- | :--- | :--- |\n| thursday, feb. 7 | 1:26 a.m. | 2.6 ft (low) |\n| | 7:26 a.m. | 6.4 ft (high) |\n| | 2:29 p.m. | -0.8 ft (low) |\n| | 9:21 p.m. | 4.8 ft (high) |\n| friday, feb. 8 | 2:24 a.m. | 1.5 ft (low) |\n| | 8:22 a.m. | 6.5 ft (high) |\n| | 3:16 p.m. | -1.6 ft (low) |\n| | 10:02 p.m. | 5.1 ft (high) |\n\nwhich list shows the low tides from lowest to highest?\n-1.6, -0.8, 1.5, 2.6\n-0.8, -1.6, 1.5, 2.6\n-0.8, 1.5, -1.6, 2.6\n2.6, 1.5, -0.8, -1.6
Answer
Explanation:
Step1: Identify low tide values
Extract the values labeled as "low" from the table: $2.6$, $-0.8$, $1.5$, and $-1.6$.
Step2: Compare negative values
Compare $-1.6$ and $-0.8$. Since $-1.6$ is further from zero on the negative side, $-1.6 < -0.8$.
Step3: Compare positive values
Compare $1.5$ and $2.6$. Clearly, $1.5 < 2.6$.
Step4: Order all values
Combine the comparisons to order from lowest to highest: $-1.6$, $-0.8$, $1.5$, $2.6$.
Answer:
-1.6, -0.8, 1.5, 2.6