a cross - country team records the amount of time it takes each runner to run a course. the coach determines…
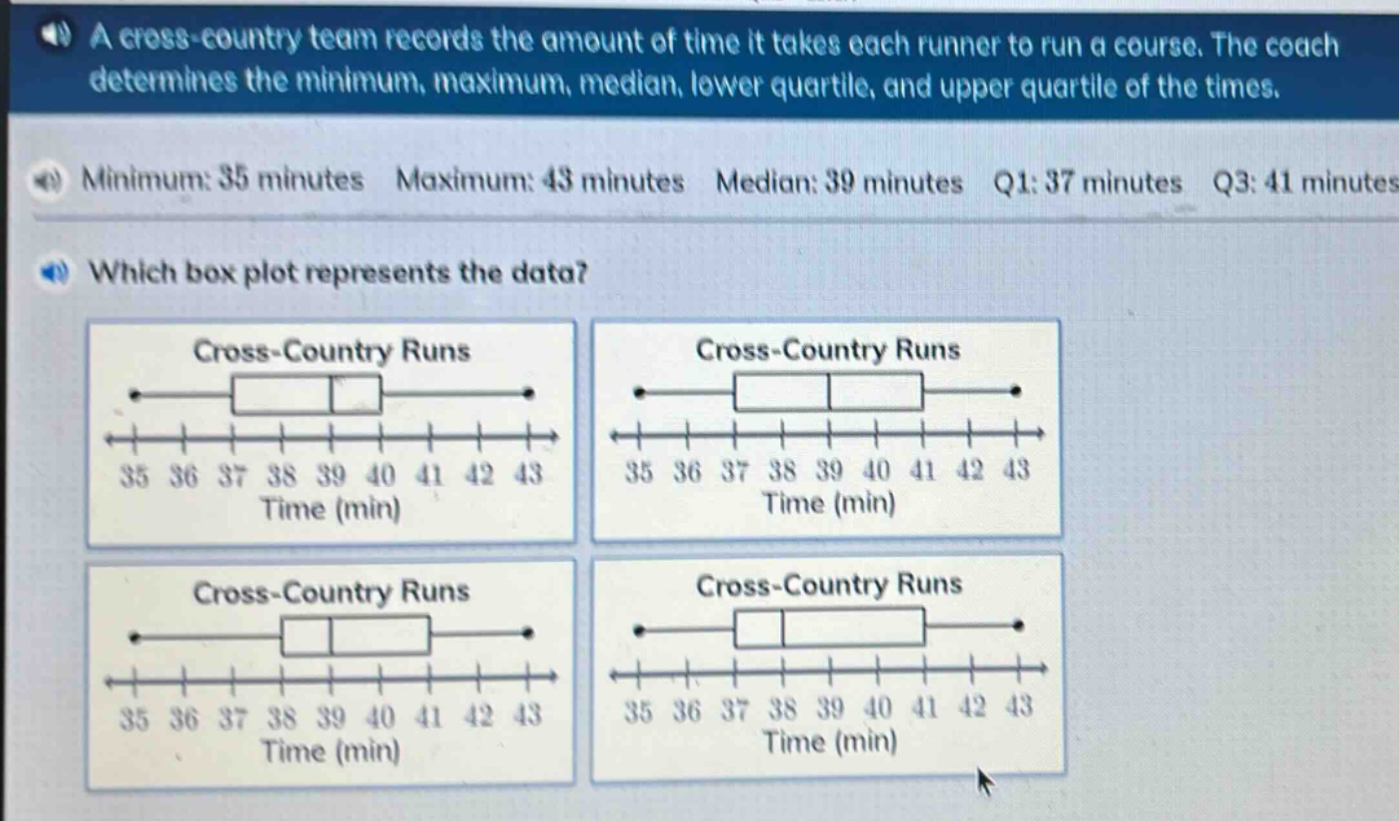
a cross - country team records the amount of time it takes each runner to run a course. the coach determines the minimum, maximum, median, lower quartile, and upper quartile of the times. minimum: 35 minutes maximum: 43 minutes median: 39 minutes q1: 37 minutes q3: 41 minutes which box plot represents the data?
Answer
Explanation:
Step1: Recall box - plot components
A box - plot has a left - most point at the minimum value, a right - most point at the maximum value. The left side of the box is at the lower quartile (Q1), the line inside the box is at the median, and the right side of the box is at the upper quartile (Q3).
Step2: Identify correct box - plot
The minimum is 35 minutes, so the left - most point should be at 35. The lower quartile (Q1) is 37 minutes, so the left side of the box should be at 37. The median is 39 minutes, so the line inside the box should be at 39. The upper quartile (Q3) is 41 minutes, so the right side of the box should be at 41. The maximum is 43 minutes, so the right - most point should be at 43.
Answer:
The box - plot that has the left - most point at 35, left side of the box at 37, line inside the box at 39, right side of the box at 41, and right - most point at 43 represents the data. Without seeing the exact visual differences in the provided box - plots, based on the described positions of the key values, you can identify the correct one among them.