dan is competing in the sponge-soak relay race during field day. he runs across the field to a bucket, fills…
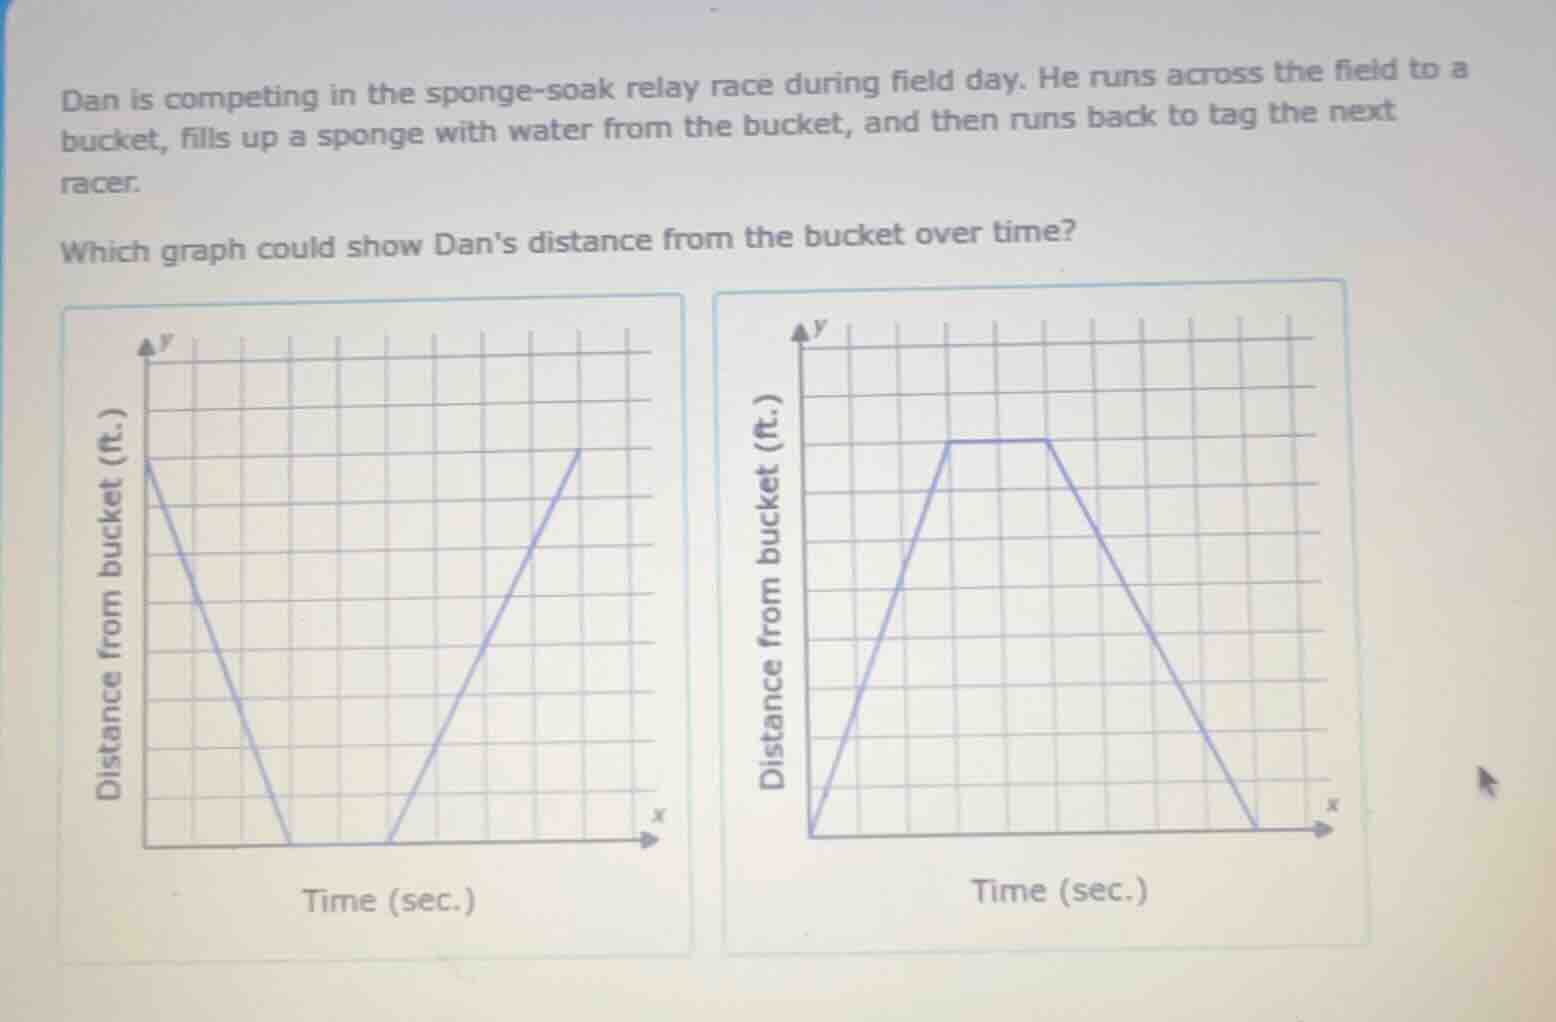
dan is competing in the sponge-soak relay race during field day. he runs across the field to a bucket, fills up a sponge with water from the bucket, and then runs back to tag the next racer.\nwhich graph could show dans distance from the bucket over time?
Answer
Brief Explanations:
- Start: Dan begins far from the bucket, so initial distance is positive.
- First movement: He runs toward the bucket, so distance decreases over time until it reaches 0.
- Middle action: He stops to fill the sponge, so distance stays at 0 for a period of time.
- Final movement: He runs back, so distance from the bucket increases over time back to the starting value.
- Match to graphs: The first graph matches this sequence: starts high, decreases to 0, stays at 0, then increases back to the starting height. The second graph shows the opposite (starting at 0, moving away, stopping, then returning to 0), which does not fit Dan's path.
Answer:
The left graph (first graph, starting at a positive distance, decreasing to 0, pausing, then increasing back to the initial distance)