data was collected on the price per cupcake on orders of different amounts from a bakery. the scatter plot…
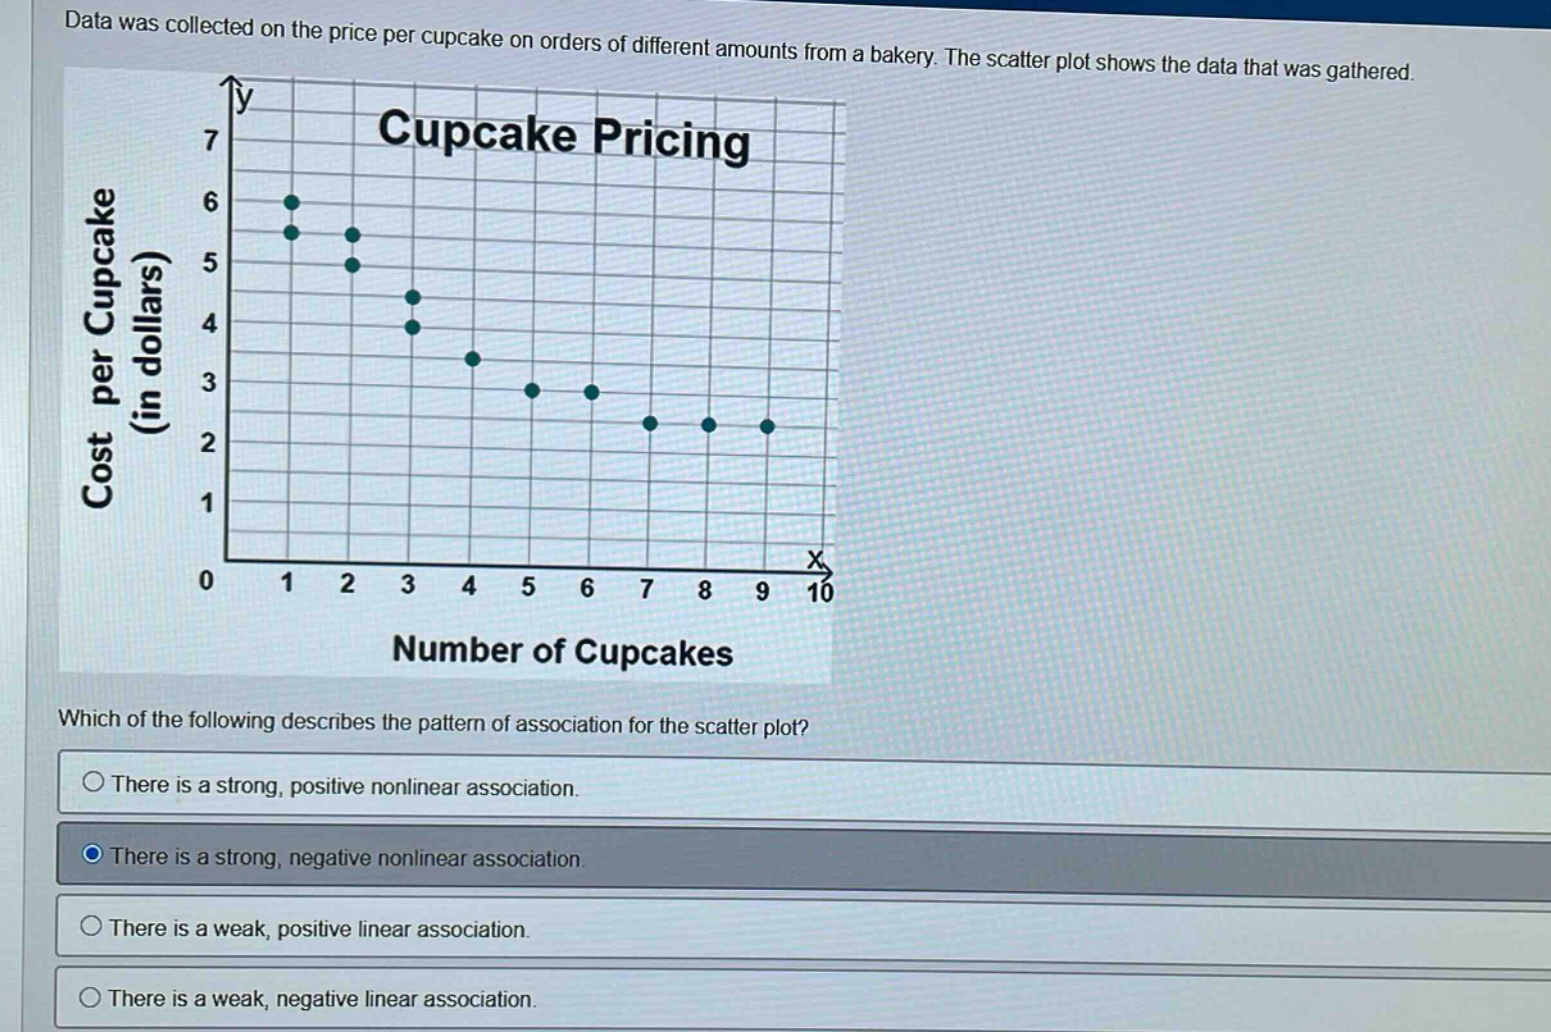
data was collected on the price per cupcake on orders of different amounts from a bakery. the scatter plot shows the data that was gathered. which of the following describes the pattern of association for the scatter plot? there is a strong, positive nonlinear association. there is a strong, negative nonlinear association. there is a weak, positive linear association. there is a weak, negative linear association.
Answer
Explanation:
Step1: Observe the scatter - plot trend
As the number of cupcakes (x - axis) increases, the cost per cupcake (y - axis) decreases.
Step2: Determine the strength and type of association
The points seem to follow a non - straight line pattern and are closely grouped together, indicating a strong association. Since the y - values decrease as x - values increase, it is a negative association. And the pattern is not linear.
Answer:
There is a strong, negative nonlinear association.