the data in the frequency table were collected in response to the question, \what percentage of your free…
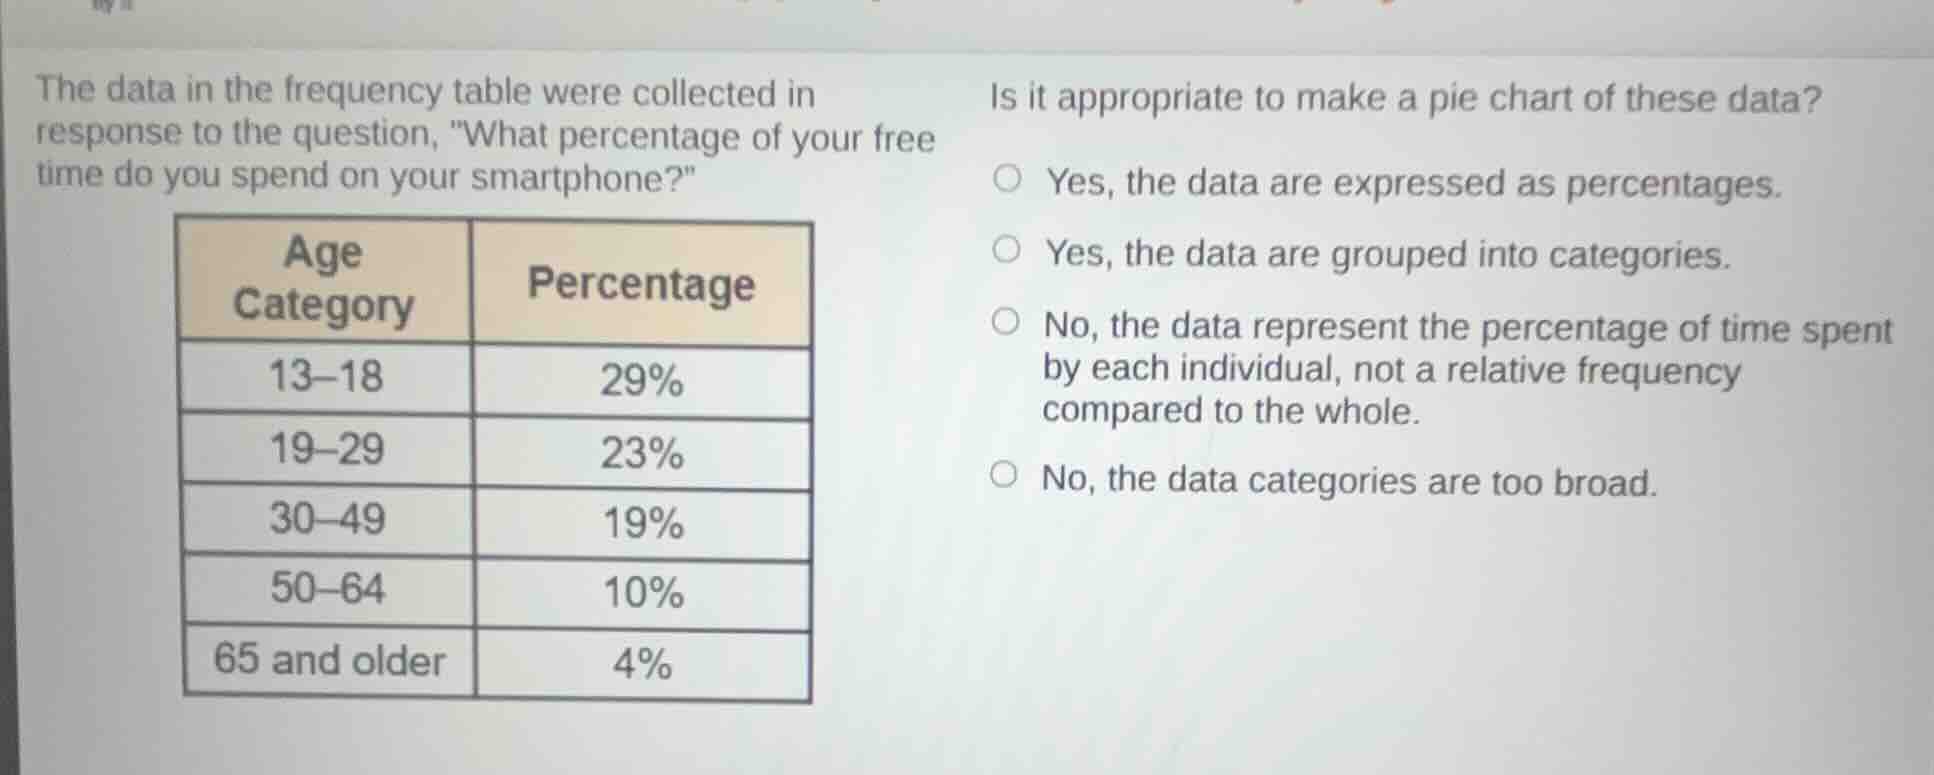
the data in the frequency table were collected in response to the question, \what percentage of your free time do you spend on your smartphone?\\n\n| age category | percentage |\n| :--- | :--- |\n| 13-18 | 29% |\n| 19-29 | 23% |\n| 30-49 | 19% |\n| 50-64 | 10% |\n| 65 and older | 4% |\n\nis it appropriate to make a pie chart of these data?\n\n- yes, the data are expressed as percentages.\n- yes, the data are grouped into categories.\n- no, the data represent the percentage of time spent by each individual, not a relative frequency compared to the whole.\n- no, the data categories are too broad.
Answer
Brief Explanations:
A pie chart is used to represent parts of a whole, where the sum of all categories equals $100%$ of a single population or total quantity. In this dataset, the percentages represent the average amount of free time individuals within specific age groups spend on their smartphones. These are independent measurements for each group, not components of a single total. Furthermore, the sum of the percentages in the table ($29% + 23% + 19% + 10% + 4% = 85%$) does not equal $100%$, confirming that these values do not represent a relative frequency distribution of a whole.
Answer:
No, the data represent the percentage of time spent by each individual, not a relative frequency compared to the whole.