the data given in the table below show some of the results of a study comparing the height of a certain…
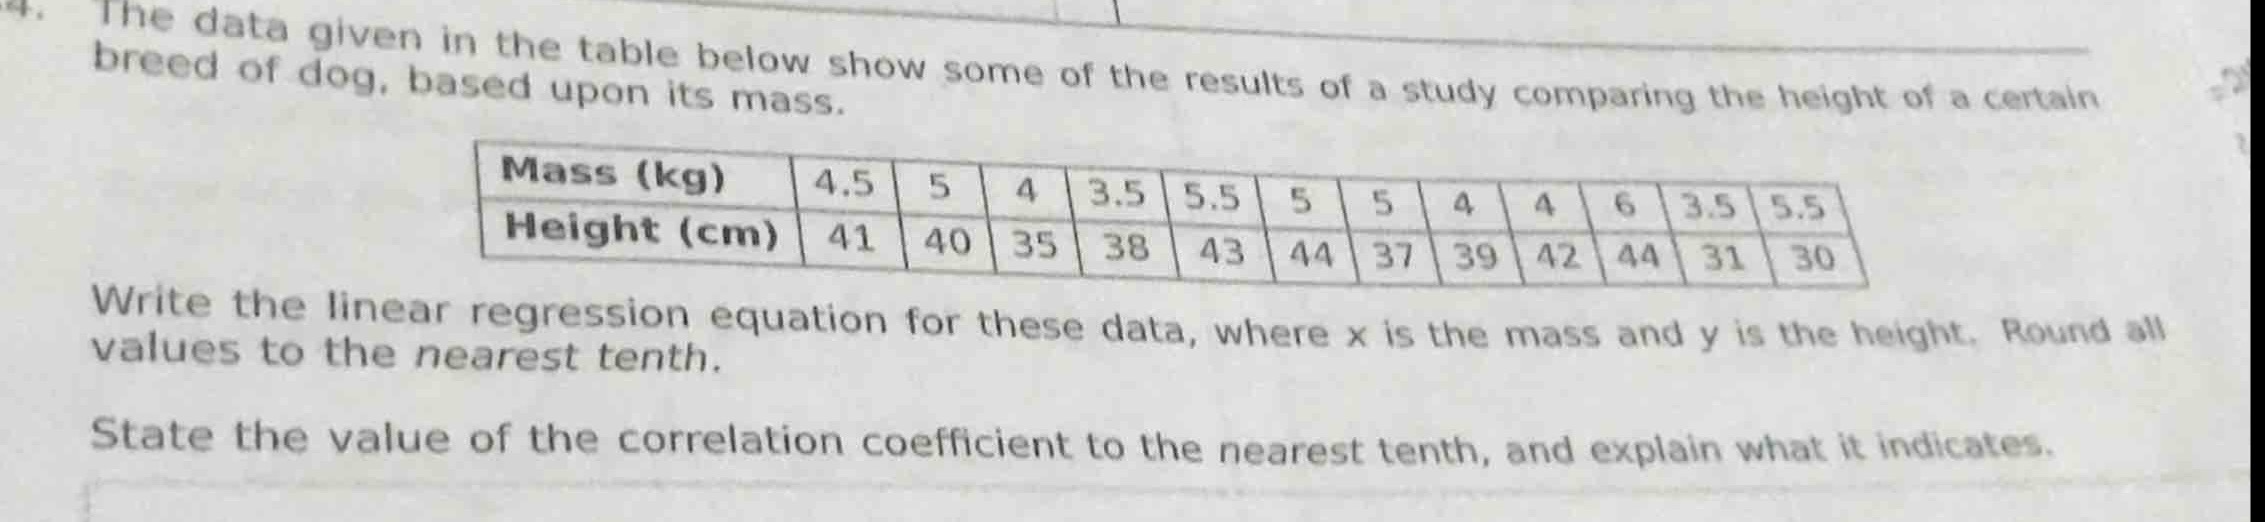
the data given in the table below show some of the results of a study comparing the height of a certain breed of dog, based upon its mass.\n| mass (kg) | 4.5 | 5 | 4 | 3.5 | 5.5 | 5 | 5 | 4 | 4 | 6 | 3.5 | 5.5 |\n| height (cm) | 41 | 40 | 35 | 38 | 43 | 44 | 37 | 39 | 42 | 44 | 31 | 30 |\nwrite the linear regression equation for these data, where x is the mass and y is the height. round all values to the nearest tenth.\nstate the value of the correlation coefficient to the nearest tenth, and explain what it indicates.
Answer
Explanation:
Step1: Calculate the means of x and y
Let (x) be the mass and (y) be the height. The mean of (x), (\bar{x}=\frac{4.5 + 5+4+3.5+5.5+5+5+4+4+6+3.5+5.5}{12}=\frac{55}{12}\approx4.6) The mean of (y), (\bar{y}=\frac{41 + 40+35+38+43+44+37+39+42+44+31+30}{12}=\frac{464}{12}\approx38.7)
Step2: Calculate the slope (b_1)
The formula for the slope (b_1=\frac{\sum_{i = 1}^{n}(x_i-\bar{x})(y_i - \bar{y})}{\sum_{i=1}^{n}(x_i-\bar{x})^2}) First, calculate ((x_i-\bar{x})(y_i - \bar{y})) and ((x_i-\bar{x})^2) for each (i):
| (x_i) | (y_i) | (x_i-\bar{x}) | (y_i - \bar{y}) | ((x_i-\bar{x})(y_i - \bar{y})) | ((x_i-\bar{x})^2) |
|---|---|---|---|---|---|
| (4.5) | (41) | (-0.1) | (2.3) | (- 0.23) | (0.01) |
| (5) | (40) | (0.4) | (1.3) | (0.52) | (0.16) |
| (4) | (35) | (-0.6) | (-3.7) | (2.22) | (0.36) |
| (3.5) | (38) | (-1.1) | (-0.7) | (0.77) | (1.21) |
| (5.5) | (43) | (0.9) | (4.3) | (3.87) | (0.81) |
| (5) | (44) | (0.4) | (5.3) | (2.12) | (0.16) |
| (5) | (37) | (0.4) | (-1.7) | (-0.68) | (0.16) |
| (4) | (39) | (-0.6) | (0.3) | (-0.18) | (0.36) |
| (4) | (42) | (-0.6) | (3.3) | (-1.98) | (0.36) |
| (6) | (44) | (1.4) | (5.3) | (7.42) | (1.96) |
| (3.5) | (31) | (-1.1) | (-7.7) | (8.47) | (1.21) |
| (5.5) | (30) | (0.9) | (-8.7) | (-7.83) | (0.81) |
| (\sum_{i = 1}^{12}(x_i-\bar{x})(y_i - \bar{y})=-0.23 + 0.52+2.22+0.77+3.87+2.12-0.68-0.18-1.98+7.42+8.47-7.83 = 14.4) | |||||
| (\sum_{i=1}^{12}(x_i-\bar{x})^2=0.01+0.16+0.36+1.21+0.81+0.16+0.16+0.36+0.36+1.96+1.21+0.81 = 7.56) | |||||
| (b_1=\frac{14.4}{7.56}\approx1.9) |
Step3: Calculate the y - intercept (b_0)
The formula for the y - intercept (b_0=\bar{y}-b_1\bar{x}) (b_0 = 38.7-1.9\times4.6=38.7 - 8.74=29.96\approx30.0) The linear regression equation is (y = 1.9x+30.0)
Step4: Calculate the correlation coefficient (r)
The formula for the correlation coefficient (r=\frac{\sum_{i = 1}^{n}(x_i-\bar{x})(y_i - \bar{y})}{\sqrt{\sum_{i=1}^{n}(x_i-\bar{x})^2\sum_{i = 1}^{n}(y_i-\bar{y})^2}}) First, calculate ((y_i-\bar{y})^2) for each (i) and (\sum_{i = 1}^{n}(y_i-\bar{y})^2) (\sum_{i = 1}^{n}(y_i-\bar{y})^2=(41 - 38.7)^2+(40 - 38.7)^2+(35 - 38.7)^2+(38 - 38.7)^2+(43 - 38.7)^2+(44 - 38.7)^2+(37 - 38.7)^2+(39 - 38.7)^2+(42 - 38.7)^2+(44 - 38.7)^2+(31 - 38.7)^2+(30 - 38.7)^2) (=5.29+1.69 + 13.69+0.49+18.49+28.09+2.89+0.09+10.89+28.09+59.29+75.69=234.2) (r=\frac{14.4}{\sqrt{7.56\times234.2}}=\frac{14.4}{\sqrt{1770.552}}\approx\frac{14.4}{42.07}\approx0.3) The correlation coefficient (r\approx0.3) indicates a weak positive linear relationship between the mass and height of the dogs. That is, as the mass of the dog increases, the height tends to increase slightly, but the relationship is not very strong.
Answer:
The linear regression equation is (y = 1.9x + 30.0). The correlation coefficient (r\approx0.3), which indicates a weak positive linear relationship between the mass and height of the dogs.