data is often displayed using numbers and categories. which types of graphs are most appropriate for…
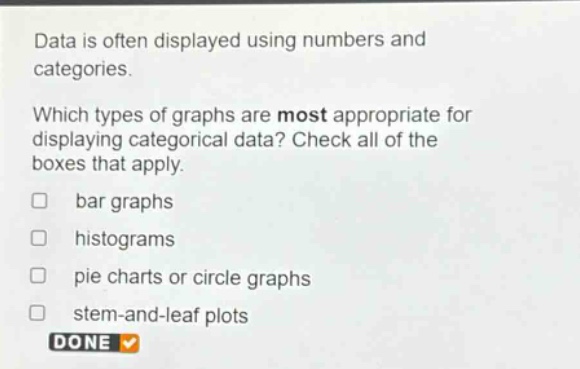
data is often displayed using numbers and categories. which types of graphs are most appropriate for displaying categorical data? check all of the boxes that apply. bar graphs histograms pie charts or circle graphs stem - and - leaf plots done
Answer
Brief Explanations:
Bar graphs compare quantities across categories. Pie - charts show proportions of a whole for different categories. Histograms are for numerical data grouped into intervals, not for categorical data. Stem - and - leaf plots are also for numerical data representation.
Answer:
A. bar graphs, C. pie charts or circle graphs