the data points on the scatter plot below show the amount of time spent watching television and the amount…
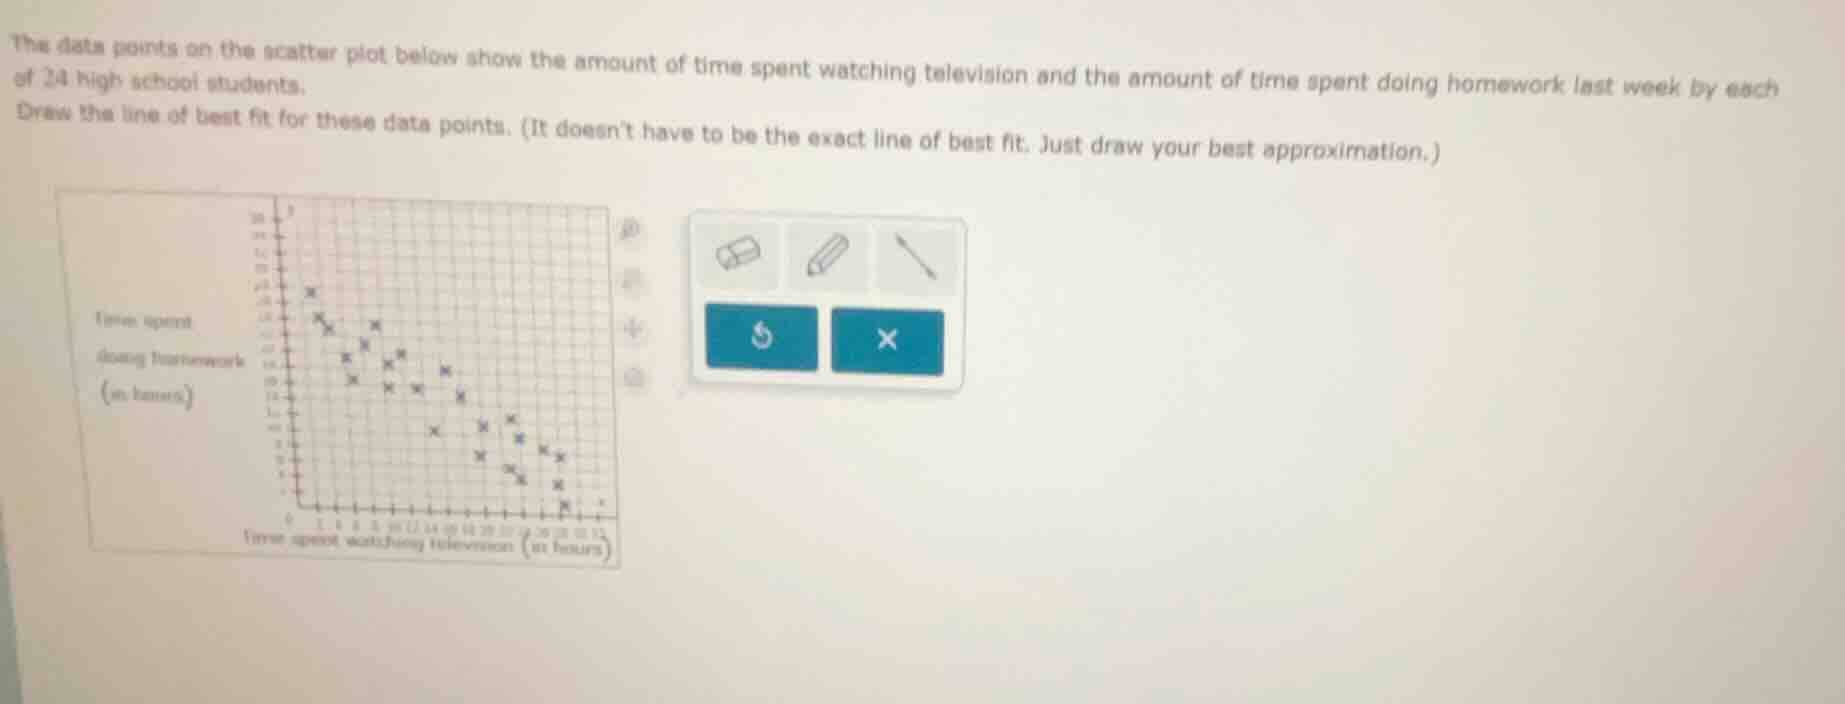
the data points on the scatter plot below show the amount of time spent watching television and the amount of time spent doing homework last week by each of 24 high school students.\ndraw the line of best fit for these data points. (it doesnt have to be the exact line of best fit. just draw your best approximation.)
Answer
Explanation:
Step1: Identify trend direction
Observe that as television time (x-axis) increases, homework time (y-axis) decreases, so the line will have a negative slope.
Step2: Balance data points
Approximate a line that splits the data roughly in half, with about equal points above and below the line. A good approximation would pass through points like (2, 20) and (10, 8).
Step3: Define line equation
Calculate the slope: $m=\frac{8-20}{10-2}=\frac{-12}{8}=-1.5$ Use point-slope form with (2,20): $y-20=-1.5(x-2)$ Simplify to slope-intercept: $y=-1.5x+23$
Answer:
A line with a negative slope, approximately following the equation $y = -1.5x + 23$, that balances the scatter of data points (with roughly half the points above and half below the line) is the best approximate line of best fit. When drawing, this line would start near (0, 23) on the y-axis and slope down to cross near (15.3, 0) on the x-axis, passing through the middle of the plotted data points.