the data points on the scatter plot below show the weight and fuel efficiency for each of 21 vehicles. draw…
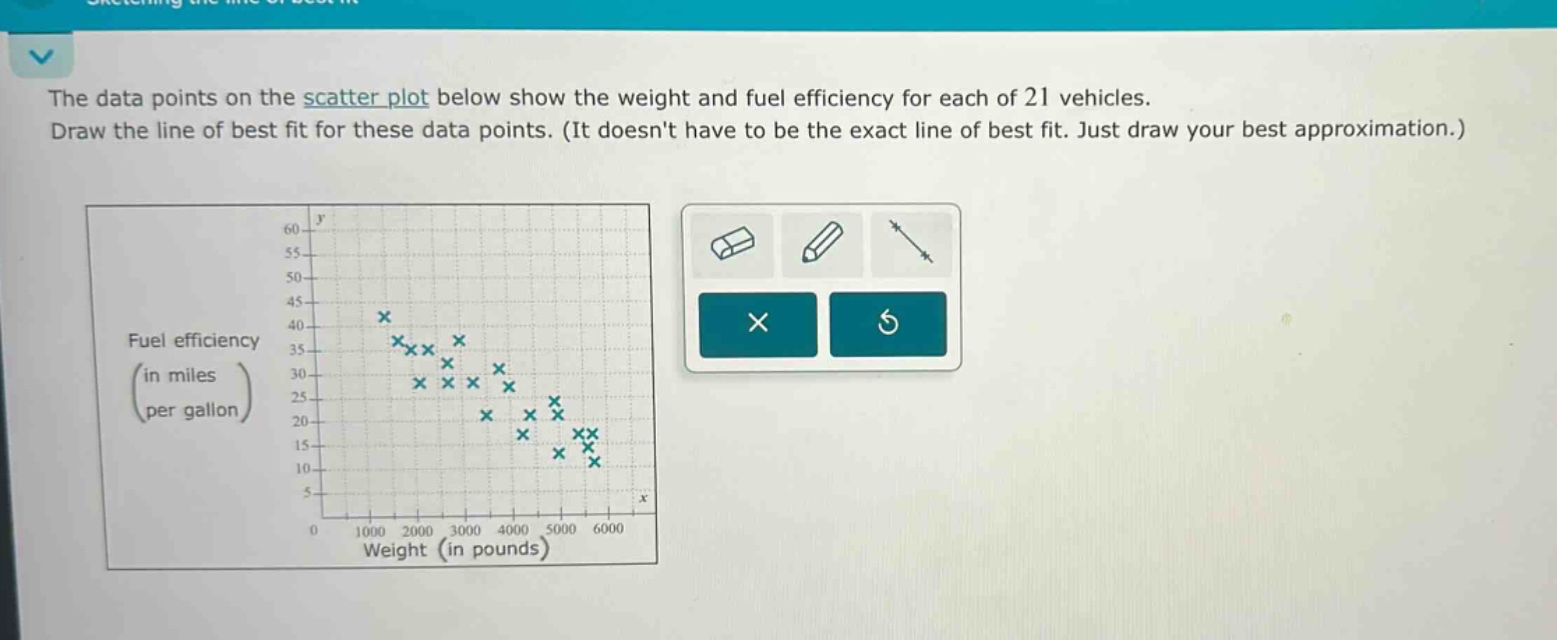
the data points on the scatter plot below show the weight and fuel efficiency for each of 21 vehicles. draw the line of best fit for these data points. (it doesnt have to be the exact line of best fit. just draw your best approximation.) fuel efficiency (in miles per gallon) weight (in pounds)
Answer
Explanation:
Step1: Observe data distribution
Notice that as weight (x - axis) increases, fuel - efficiency (y - axis) decreases.
Step2: Select two representative points
Pick two points that seem to represent the overall trend. For example, one near the upper - left and one near the lower - right of the data cloud.
Step3: Draw the line
Connect the two selected points with a straight line that passes as close as possible to the majority of the data points.
Answer:
This is a visual task and cannot be directly provided in text. The general approach is to draw a straight line that shows a negative linear trend through the data points on the scatter - plot, indicating that as vehicle weight increases, fuel efficiency decreases.