the data points show the area y (in square kilometers) that a certain forest covers after being inhabited…
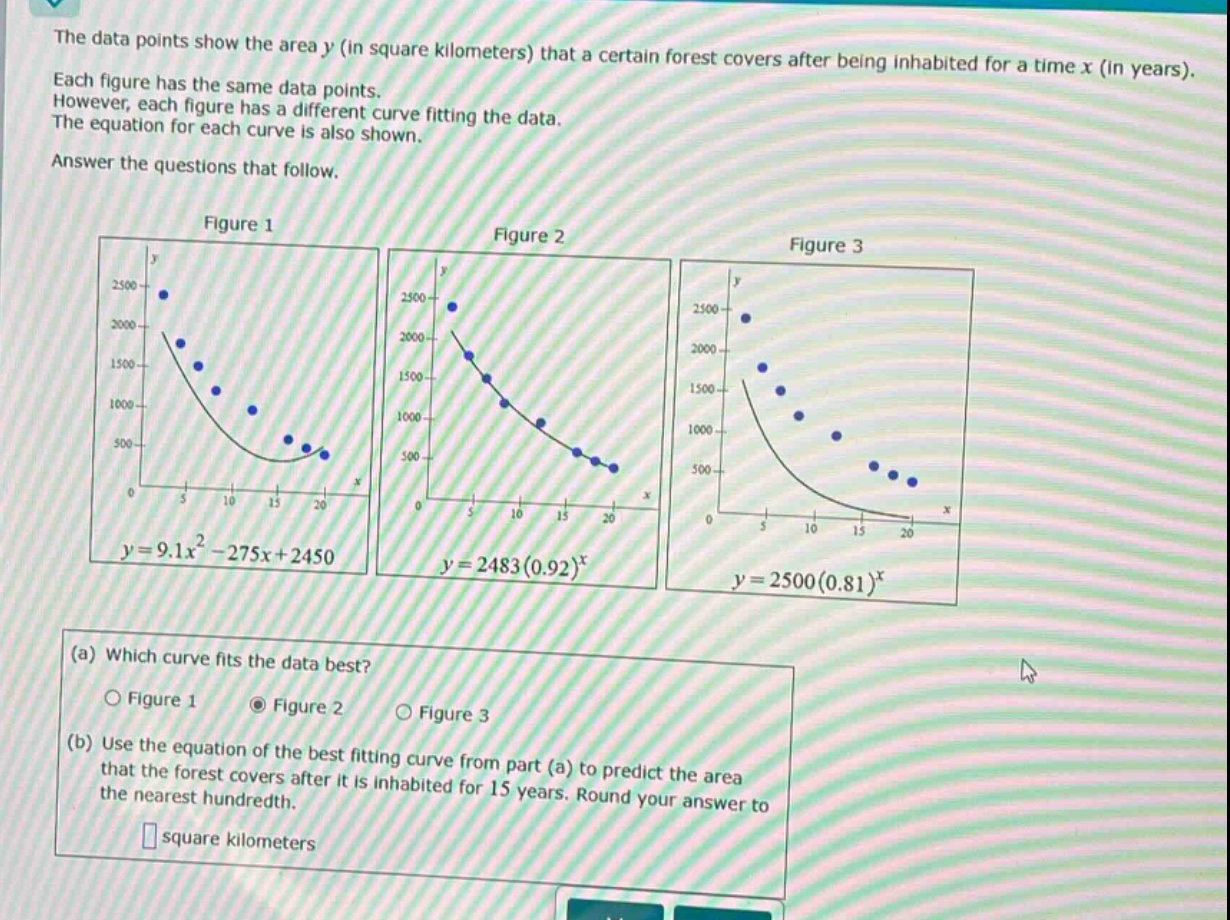
the data points show the area y (in square kilometers) that a certain forest covers after being inhabited for a time x (in years). each figure has the same data points. however, each figure has a different curve fitting the data. the equation for each curve is also shown. answer the questions that follow. figure 1 figure 2 figure 3 (a) which curve fits the data best? o figure 1 o figure 2 o figure 3 (b) use the equation of the best - fitting curve from part (a) to predict the area that the forest covers after it is inhabited for 15 years. round your answer to the nearest hundredth. square kilometers
Answer
Explanation:
Step1: Identify the best - fitting curve
Visually, Figure 2 seems to pass closer to most of the data points compared to Figure 1 and Figure 3.
Step2: Use the equation of the best - fitting curve for prediction
The equation of the best - fitting curve (from Figure 2) is $y = 2483(0.92)^{x}$. Substitute $x = 15$ into the equation. $y=2483\times(0.92)^{15}$ First, calculate $(0.92)^{15}$. Let $a=(0.92)^{15}$. Using a calculator, $a\approx0.2863$. Then, $y = 2483\times0.2863$. $y=2483\times0.2863 = 710.8829\approx710.88$
Answer:
(a) Figure 2 (b) 710.88 square kilometers