the data points show an ocean trenchs depth y (in feet) at a distance x from a marked buoy (in feet). each…
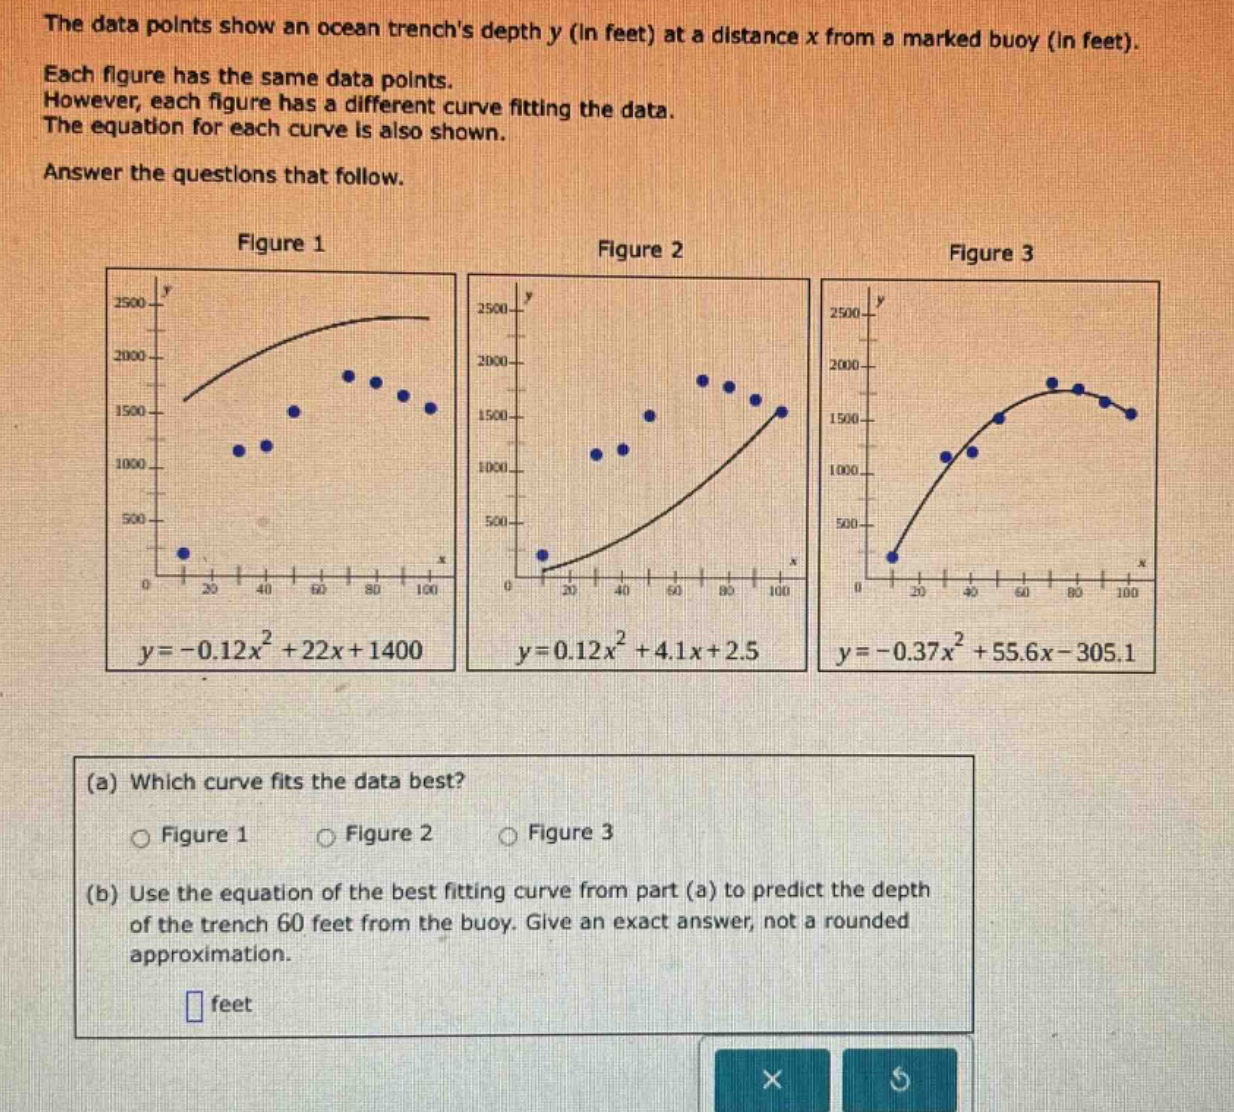
the data points show an ocean trenchs depth y (in feet) at a distance x from a marked buoy (in feet). each figure has the same data points. however, each figure has a different curve fitting the data. the equation for each curve is also shown. answer the questions that follow. figure 1 figure 2 figure 3 (a) which curve fits the data best? figure 1 figure 2 figure 3 (b) use the equation of the best fitting curve from part (a) to predict the depth of the trench 60 feet from the buoy. give an exact answer, not a rounded approximation. feet
Answer
Answer:
(a) Figure 3 (b) 1798.9
Explanation:
Step1: Visual inspection
Visually, Figure 3's curve passes closer to most data - points compared to Figure 1 and Figure 2.
Step2: Substitute (x = 60) into the equation of Figure 3
The equation of the curve in Figure 3 is (y=-0.37x^{2}+55.6x - 305.1). Substitute (x = 60) into it: [ \begin{align*} y&=-0.37\times60^{2}+55.6\times60 - 305.1\ &=-0.37\times3600+3336-305.1\ &=-1332 + 3336-305.1\ &=2004-305.1\ &=1798.9 \end{align*} ]