the data below represents the number of strikes each sams inc. employee got on the company bowling outing…
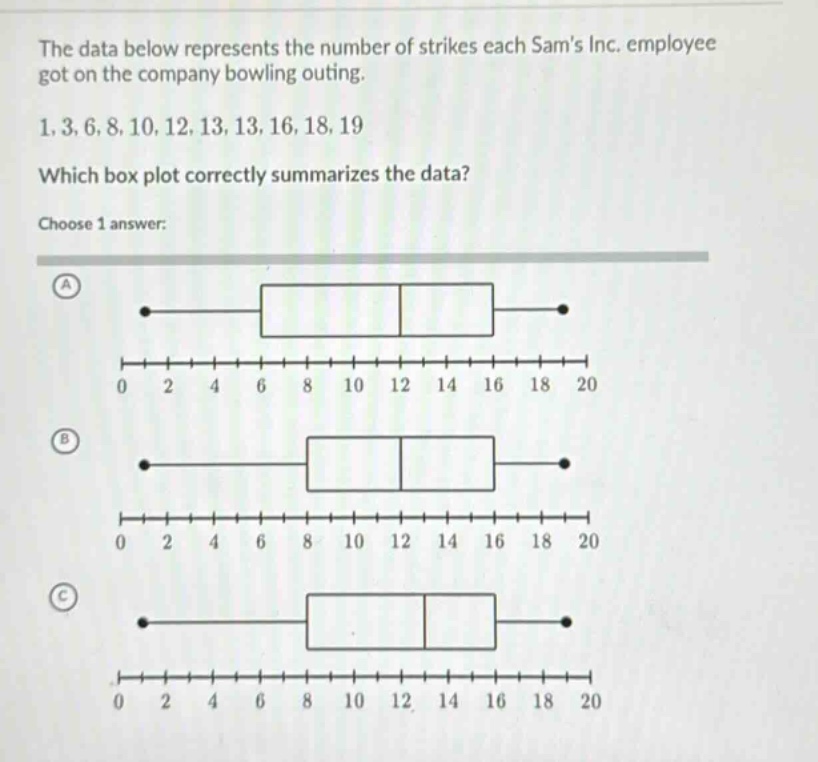
the data below represents the number of strikes each sams inc. employee got on the company bowling outing. 1, 3, 6, 8, 10, 12, 13, 13, 16, 18, 19 which box plot correctly summarizes the data? choose 1 answer:
Answer
Explanation:
Step1: Find the minimum value
The minimum value of the data - set (1,3,6,8,10,12,13,13,16,18,19) is (1).
Step2: Find the first - quartile ((Q_1))
The data set has (n = 11) values. The position of (Q_1) is (\frac{n + 1}{4}=\frac{11+1}{4}=3). So, (Q_1) is the 3rd value in the ordered data set, which is (6).
Step3: Find the median ((Q_2))
The position of the median is (\frac{n + 1}{2}=\frac{11 + 1}{2}=6). So, the median (Q_2) is the 6th value in the ordered data set, which is (12).
Step4: Find the third - quartile ((Q_3))
The position of (Q_3) is (\frac{3(n + 1)}{4}=\frac{3\times(11 + 1)}{4}=9). So, (Q_3) is the 9th value in the ordered data set, which is (16).
Step5: Find the maximum value
The maximum value of the data set is (19).
A box - plot has a box from (Q_1) to (Q_3) with a line at the median, and whiskers from the box to the minimum and maximum values. The box should start at (6), end at (16), have a line at (12), and whiskers to (1) and (19).
Answer:
We need to visually check which of the given box - plots has a minimum value of (1), (Q_1 = 6), median (=12), (Q_3 = 16), and maximum value of (19). Without seeing the full - scale options clearly, but based on the calculations, we look for a box - plot where the left - hand side of the box is at (6), the line inside the box is at (12), the right - hand side of the box is at (16), and the left - hand whisker extends to (1) and the right - hand whisker extends to (19). If we assume the box - plots are drawn to scale and labeled correctly, we can identify the correct one. Since the options are not fully described in text, we have provided the steps to calculate the key values for the box - plot. If we had to make a general statement, we would say that the box - plot with a left - hand side of the box at (6), a middle line at (12), a right - hand side of the box at (16), and whiskers going to (1) and (19) is the correct one.