the data set 80, 84, 79, 44, 87, 73, 89, 90, 82, 89, 93, 97, 77, and 71 is graphed below. use the histogram…
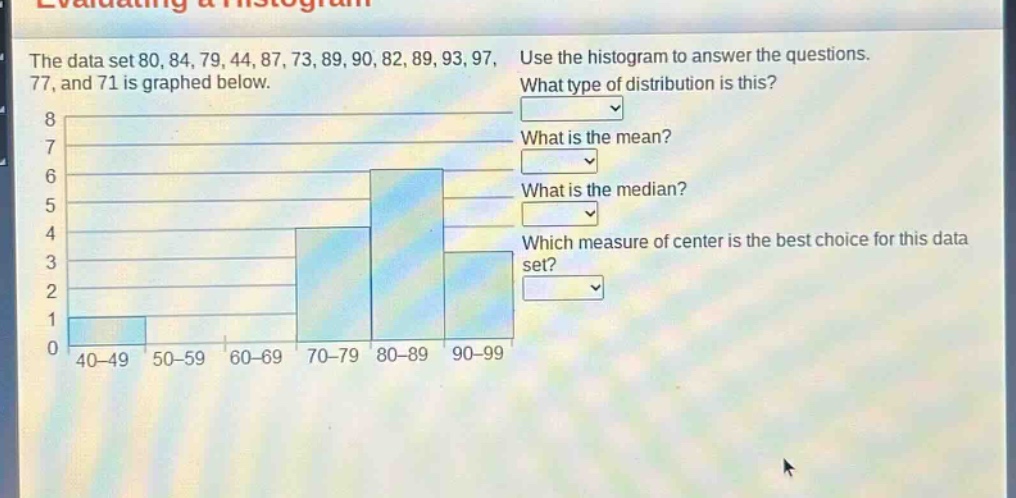
the data set 80, 84, 79, 44, 87, 73, 89, 90, 82, 89, 93, 97, 77, and 71 is graphed below. use the histogram to answer the questions. what type of distribution is this? what is the mean? what is the median? which measure of center is the best choice for this data set?
Answer
Explanation:
Step1: Arrange data in ascending order
44, 71, 73, 77, 79, 80, 82, 84, 87, 89, 89, 90, 93, 97
Step2: Calculate the mean
The sum of the data is (44 + 71+73+77+79+80+82+84+87+89+89+90+93+97 = 1145). There are (n = 14) data - points. The mean (\bar{x}=\frac{1145}{14}\approx81.79)
Step3: Calculate the median
Since (n = 14) (an even - numbered data set), the median is the average of the (\frac{n}{2}=7)th and ((\frac{n}{2}+1) = 8)th ordered data values. The 7th value is 82 and the 8th value is 84. So the median (M=\frac{82 + 84}{2}=83)
Step4: Determine the distribution type
The histogram shows that the data is concentrated around the middle values (70 - 89), with fewer values on the lower (40 - 69) and higher (90 - 99) ends. So it is a symmetric distribution.
Step5: Choose the best measure of center
Since the distribution is symmetric, both the mean and the median are good measures of center. But the mean takes into account all values in the data set, so the mean is a slightly better choice.
Answer:
What type of distribution is this? Symmetric What is the mean? Approximately 81.79 What is the median? 83 Which measure of center is the best choice for this data set? Mean