in the data set below, what is the interquartile range? 1 1 1 1 3 3 5 6
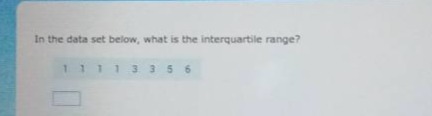
in the data set below, what is the interquartile range? 1 1 1 1 3 3 5 6
Answer
Explanation:
Step1: Arrange data in order
The data set is already in ascending - order: 1, 1, 1, 1, 3, 3, 5, 6.
Step2: Find the median (Q2)
There are (n = 8) data points. The median is the average of the (\frac{n}{2})th and ((\frac{n}{2}+1))th values. (\frac{8}{2}=4) and (\frac{8}{2}+1 = 5). So, (Q2=\frac{1 + 3}{2}=2).
Step3: Find the lower half and Q1
The lower - half of the data is 1, 1, 1, 1. The median of the lower - half ((Q1)) is 1.
Step4: Find the upper half and Q3
The upper - half of the data is 3, 3, 5, 6. The median of the upper - half ((Q3)) is (\frac{3+5}{2}=4).
Step5: Calculate the inter - quartile range (IQR)
(IQR = Q3 - Q1). Substitute (Q1 = 1) and (Q3 = 4) into the formula. (IQR=4 - 1=3).
Answer:
3