in the data set below, what is the interquartile range? 17 45 49 50 56 58 58 84 85
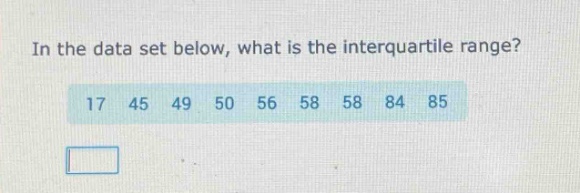
in the data set below, what is the interquartile range? 17 45 49 50 56 58 58 84 85
Answer
Explanation:
Step1: Arrange data in order
The data is already in ascending - order: 17, 45, 49, 50, 56, 58, 58, 84, 85.
Step2: Find the median (Q2)
There are 9 data points. The median is the 5th value. So, Q2 = 56.
Step3: Find the lower half and Q1
The lower half of the data is 17, 45, 49, 50. The median of the lower half (Q1) is the average of the 2nd and 3rd values. Q1=$\frac{45 + 49}{2}=\frac{94}{2}=47$.
Step4: Find the upper half and Q3
The upper half of the data is 58, 58, 84, 85. The median of the upper half (Q3) is the average of the 2nd and 3rd values. Q3=$\frac{58+84}{2}=\frac{142}{2}=71$.
Step5: Calculate the inter - quartile range (IQR)
IQR = Q3 - Q1. So, IQR=71 - 47 = 24.
Answer:
24