in the data set below, what is the interquartile range? 50 74 75 75 92 97 99
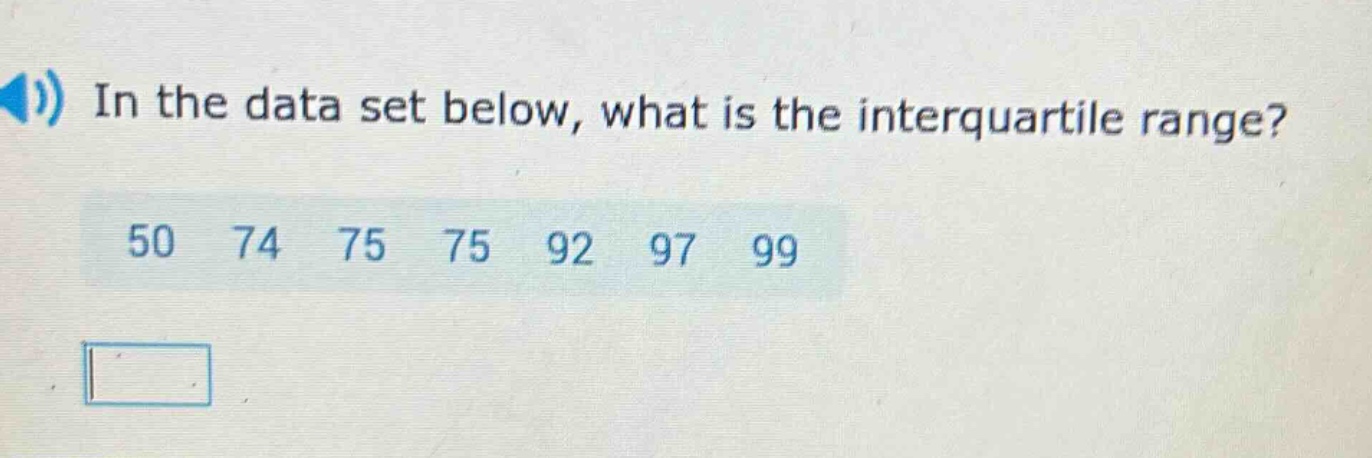
in the data set below, what is the interquartile range? 50 74 75 75 92 97 99
Answer
Answer:
23
Explanation:
Step1: Arrange data in order
50, 74, 75, 75, 92, 97, 99
Step2: Find median (Q2)
Since there are 7 data - points, the median is the 4th value. So Q2 = 75.
Step3: Find lower half
The lower half is 50, 74, 75. The median of the lower half (Q1) is 74.
Step4: Find upper half
The upper half is 92, 97, 99. The median of the upper half (Q3) is 97.
Step5: Calculate inter - quartile range
IQR=Q3 - Q1 = 97 - 74=23