the data set below has a lower quartile of 13 and an upper quartile of 37.\n1, 12, 13, 15, 18, 20, 35, 37…
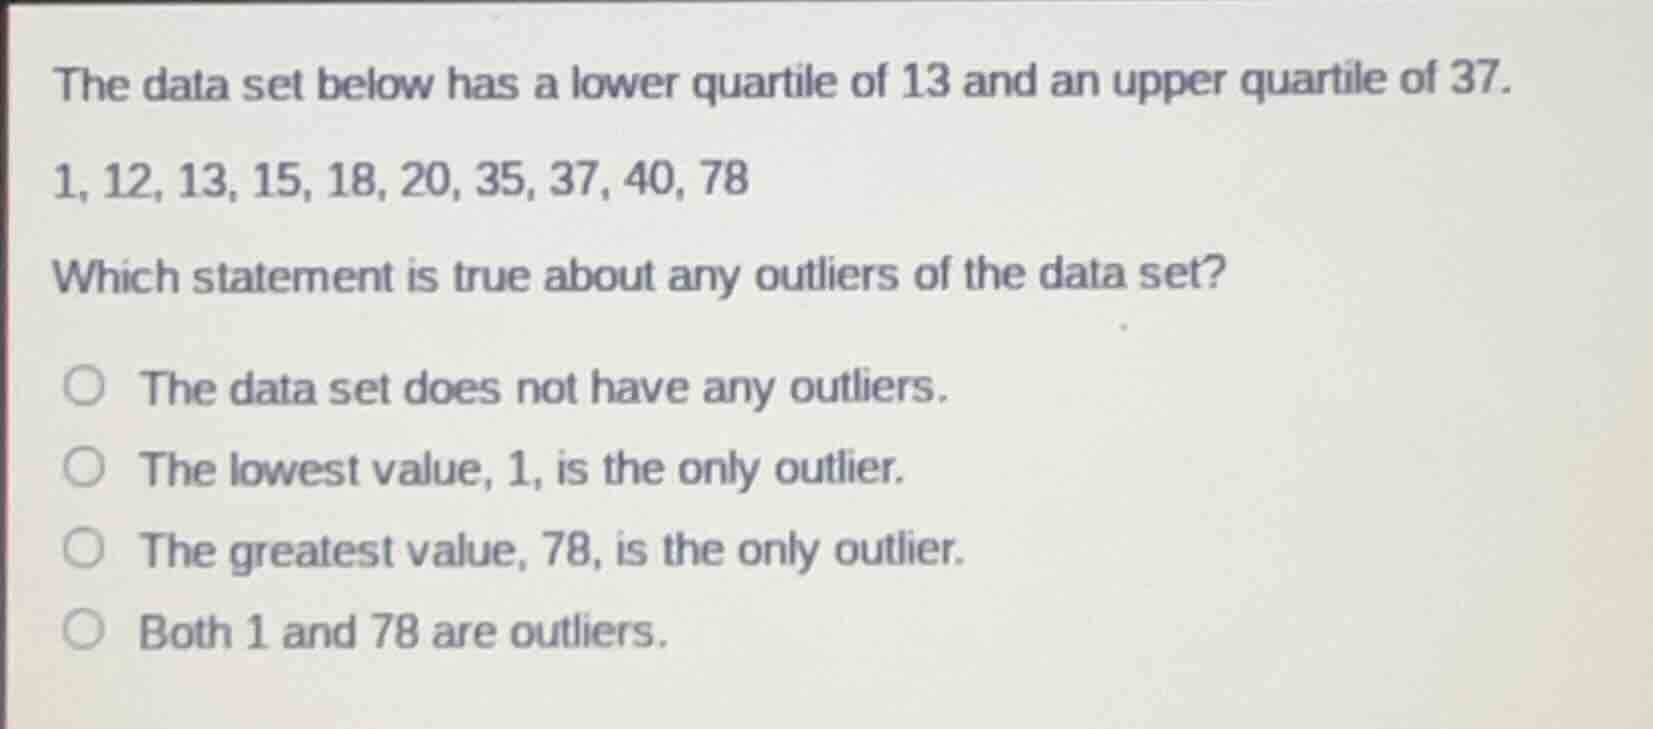
the data set below has a lower quartile of 13 and an upper quartile of 37.\n1, 12, 13, 15, 18, 20, 35, 37, 40, 78\nwhich statement is true about any outliers of the data set?\n○ the data set does not have any outliers.\n○ the lowest value, 1, is the only outlier.\n○ the greatest value, 78, is the only outlier.\n○ both 1 and 78 are outliers.
Answer
Explanation:
Step1: Calculate the interquartile range (IQR)
The interquartile range (IQR) is calculated as the difference between the upper quartile (Q3) and the lower quartile (Q1). Given ( Q1 = 13 ) and ( Q3 = 37 ), we have: [ IQR = Q3 - Q1 = 37 - 13 = 24 ]
Step2: Determine the lower and upper bounds for outliers
The lower bound for outliers is calculated as ( Q1 - 1.5 \times IQR ), and the upper bound is ( Q3 + 1.5 \times IQR ).
- Lower bound: [ Q1 - 1.5 \times IQR = 13 - 1.5 \times 24 = 13 - 36 = -23 ]
- Upper bound: [ Q3 + 1.5 \times IQR = 37 + 1.5 \times 24 = 37 + 36 = 73 ]
Step3: Check each data point against the bounds
- For the value 1: Since ( -23 < 1 < 73 ), 1 is not an outlier.
- For the value 78: Since ( 78 > 73 ), 78 is an outlier.
- Other values (12, 13, 15, 18, 20, 35, 37, 40) are between -23 and 73, so they are not outliers.