a data set has a lower quartile of 3 and an interquartile range of 5. which box plot could represent this…
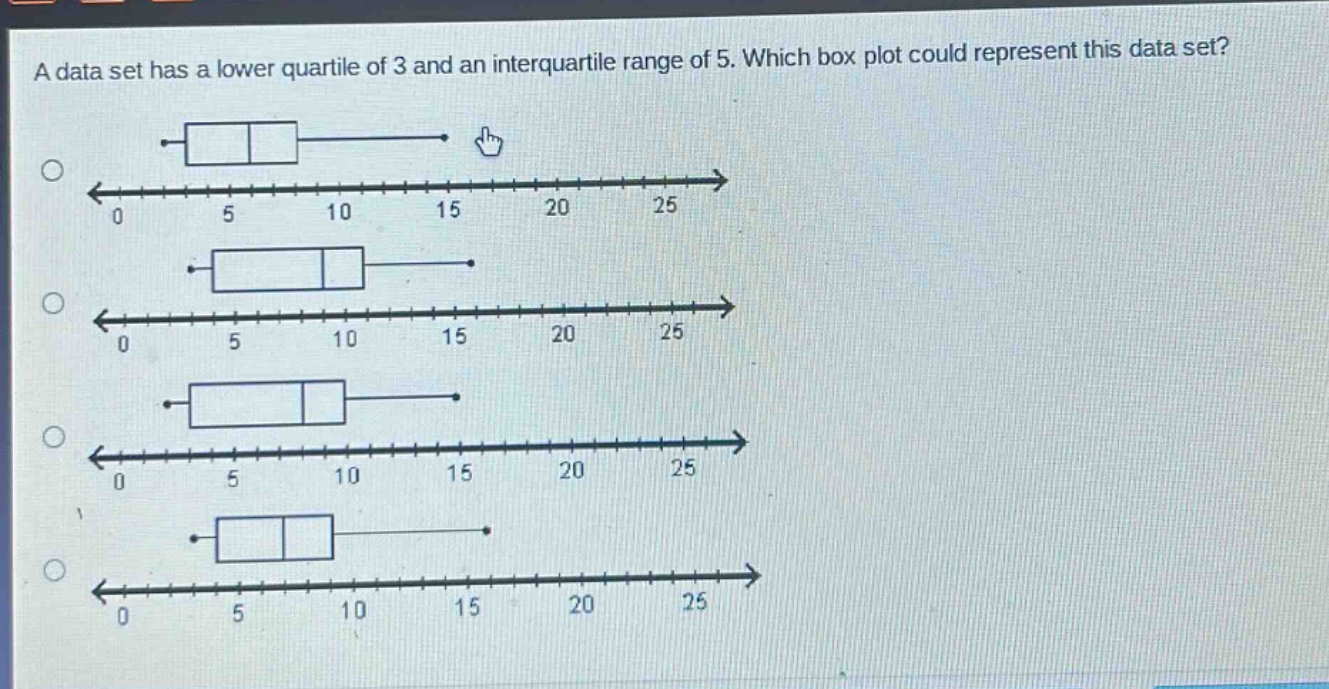
a data set has a lower quartile of 3 and an interquartile range of 5. which box plot could represent this data set?
Answer
Explanation:
Step1: Recall inter - quartile range formula
The inter - quartile range (IQR) is given by $IQR = Q_3 - Q_1$, where $Q_1$ is the lower quartile and $Q_3$ is the upper quartile. We know that $Q_1 = 3$ and $IQR=5$.
Step2: Calculate upper quartile
Substitute the known values into the formula: $5=Q_3 - 3$. Solving for $Q_3$, we get $Q_3=3 + 5=8$.
Step3: Analyze box - plots
In a box - plot, the left - hand side of the box represents $Q_1$ and the right - hand side of the box represents $Q_3$. We need to find a box - plot where the left side of the box is at 3 and the right side of the box is at 8.
Answer:
We need to visually inspect the box - plots to find the one where the left end of the box is at 3 and the right end of the box is at 8. Without the actual visual content of the box - plots being described in text (since we can't directly see the images), the general approach to answering is to find the box - plot with the left side of the box at 3 and right side at 8. If we assume the box - plots are labeled correctly on the number line, we look for the box - plot where the start of the box is at 3 and the end of the box is at 8.