the data set represents the number of minutes dan spent on his homework each night. 30, 35, 35, 45, 46, 46…
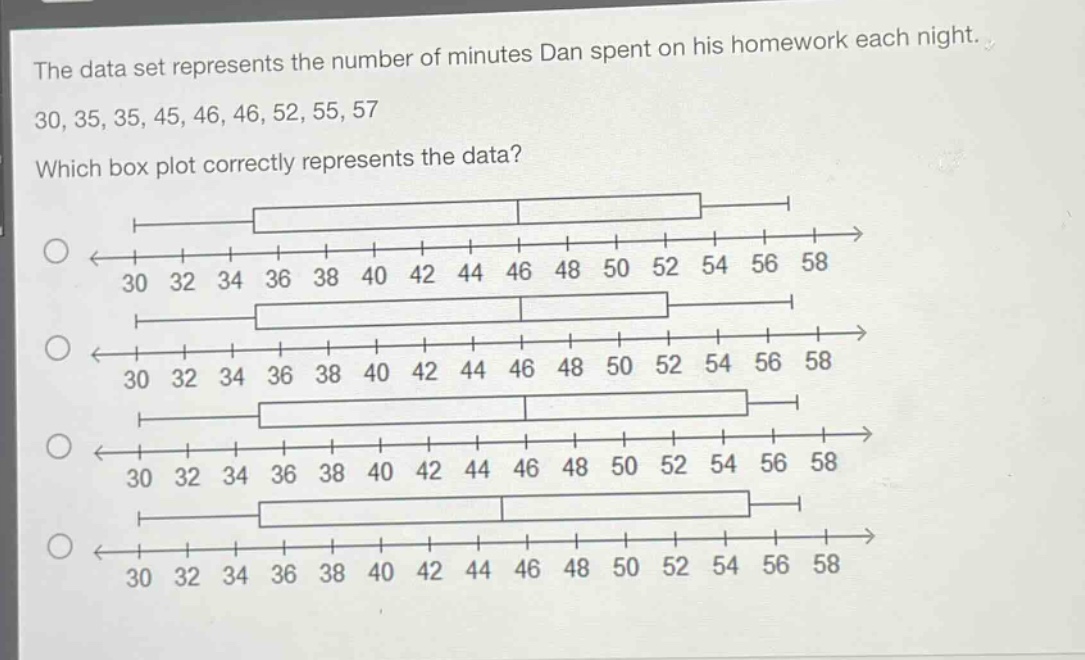
the data set represents the number of minutes dan spent on his homework each night. 30, 35, 35, 45, 46, 46, 52, 55, 57 which box plot correctly represents the data?
Answer
Explanation:
Step1: Find the minimum value
The minimum value of the data - set (30,35,35,45,46,46,52,55,57) is (30).
Step2: Find the first quartile ((Q_1))
The data - set has (n = 9) values. The position of (Q_1) is (\frac{n + 1}{4}=\frac{9+1}{4}=2.5). So, (Q_1=\frac{35 + 35}{2}=35).
Step3: Find the median ((Q_2))
The position of the median is (\frac{n + 1}{2}=\frac{9+1}{2}=5). So, (Q_2 = 46).
Step4: Find the third quartile ((Q_3))
The position of (Q_3) is (\frac{3(n + 1)}{4}=\frac{3\times(9 + 1)}{4}=7.5). So, (Q_3=\frac{52+55}{2}=53.5).
Step5: Find the maximum value
The maximum value of the data - set is (57).
A box - plot has a left - most point at the minimum value ((30)), the left - hand side of the box at (Q_1 = 35), the line inside the box at (Q_2=46), the right - hand side of the box at (Q_3 = 53.5), and the right - most point at the maximum value ((57)).
Answer:
We need to visually inspect the box - plots to find the one that has the minimum at (30), (Q_1) at (35), median at (46), (Q_3) at (53.5), and maximum at (57). Without the ability to label the box - plots with letters, we can't give a lettered answer, but you should look for a box - plot with these characteristics.