the data set represents the number of minutes dan spent on his homework each night. 30, 35, 35, 45, 46, 46…
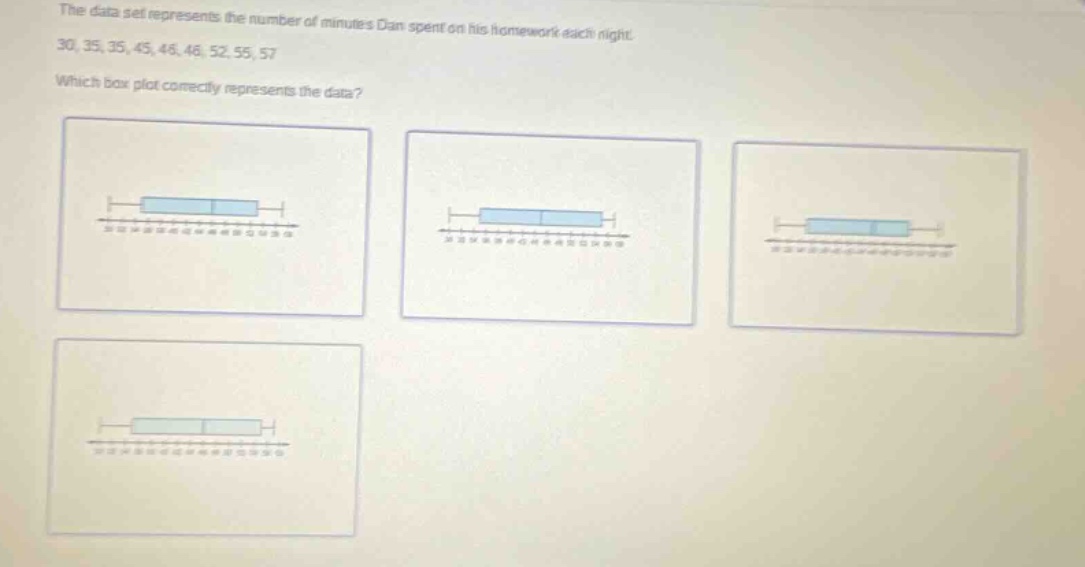
the data set represents the number of minutes dan spent on his homework each night. 30, 35, 35, 45, 46, 46, 52, 55, 57. which box - plot correctly represents the data?
Answer
Explanation:
Step1: Find the minimum value
The data set is 30, 35, 35, 45, 46, 46, 52, 55, 57. The minimum value is 30.
Step2: Find the first - quartile ($Q_1$)
There are $n = 9$ data points. The position of $Q_1$ is $\frac{n + 1}{4}=\frac{9+1}{4}=2.5$. So, $Q_1=\frac{35 + 35}{2}=35$.
Step3: Find the median ($Q_2$)
The position of the median is $\frac{n + 1}{2}=\frac{9+1}{2}=5$. So, $Q_2 = 46$.
Step4: Find the third - quartile ($Q_3$)
The position of $Q_3$ is $\frac{3(n + 1)}{4}=\frac{3\times(9 + 1)}{4}=7.5$. So, $Q_3=\frac{52+55}{2}=53.5$.
Step5: Find the maximum value
The maximum value is 57. A box - plot has a box from $Q_1$ to $Q_3$ with a line at the median, and whiskers from the box to the minimum and maximum values.
Answer:
We would need to visually inspect the box - plots and check which one has a minimum value of 30, $Q_1 = 35$, median of 46, $Q_3=53.5$ and maximum of 57. Without the ability to see the actual box - plots clearly, we have provided the key values to identify the correct one. If you can describe the box - plots in terms of these values (positions of minimum, $Q_1$, median, $Q_3$, maximum), we can further assist in choosing the correct one.