the data set represents the number of rings each person in a room is wearing. 0, 2, 4, 0, 2, 3, 2, 8, 6…
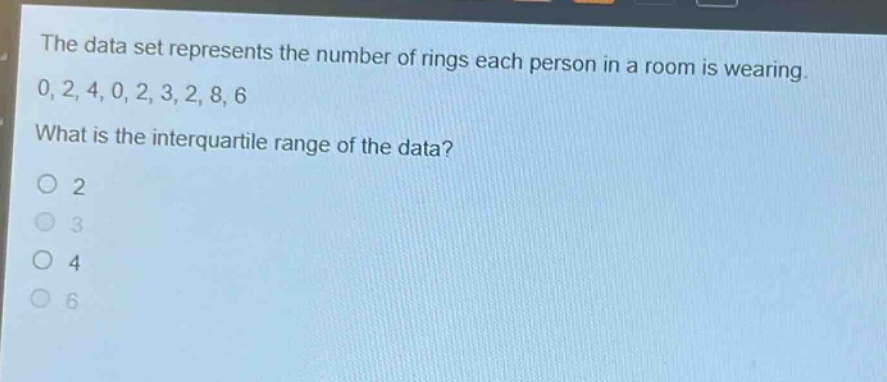
the data set represents the number of rings each person in a room is wearing. 0, 2, 4, 0, 2, 3, 2, 8, 6. what is the interquartile range of the data?\no 2\no 3\no 4\no 6
Answer
Explanation:
Step1: Sort the data
$0,0,2,2,2,3,4,6,8$
Step2: Find the median (Q2)
There are 9 data - points. The median is the 5th value. So, Q2 = 2.
Step3: Find the lower half and Q1
The lower half is $0,0,2,2$. The median of the lower half (Q1) is $\frac{0 + 2}{2}=1$.
Step4: Find the upper half and Q3
The upper half is $3,4,6,8$. The median of the upper half (Q3) is $\frac{4+6}{2}=5$.
Step5: Calculate the inter - quartile range (IQR)
IQR = Q3 - Q1 = 5 - 1 = 4.
Answer:
4