the data set represents the number of snails that each person counted on a walk after a rainstorm. 12, 13…
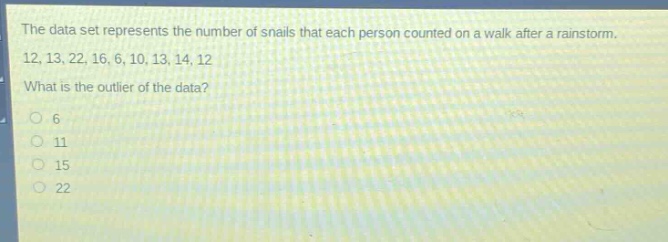
the data set represents the number of snails that each person counted on a walk after a rainstorm. 12, 13, 22, 16, 6, 10, 13, 14, 12. what is the outlier of the data?\no 6\no 11\no 15\no 22
Answer
Explanation:
Step1: Arrange data in ascending order
$6, 10, 12, 12, 13, 13, 14, 22$
Step2: Find the median
Since there are 8 data - points, the median is the average of the 4th and 5th ordered values. So, median $M=\frac{12 + 13}{2}=12.5$.
Step3: Split data into lower and upper halves
Lower half: $6, 10, 12, 12$; Upper half: $13, 13, 14, 22$.
Step4: Find the first quartile ($Q_1$) and third quartile ($Q_3$)
For the lower half (4 data - points), $Q_1=\frac{10+12}{2} = 11$. For the upper half (4 data - points), $Q_3=\frac{13 + 14}{2}=13.5$.
Step5: Calculate the inter - quartile range (IQR)
$IQR=Q_3 - Q_1=13.5−11 = 2.5$.
Step6: Determine the outlier boundaries
Lower boundary: $Q_1-1.5\times IQR=11−1.5\times2.5=11 - 3.75 = 7.25$. Upper boundary: $Q_3 + 1.5\times IQR=13.5+1.5\times2.5=13.5 + 3.75 = 17.25$.
Step7: Identify the outlier
The value 22 is outside the range $[7.25,17.25]$.
Answer:
22