the data set represents the total number of pencils each student in a class needs to sharpen…
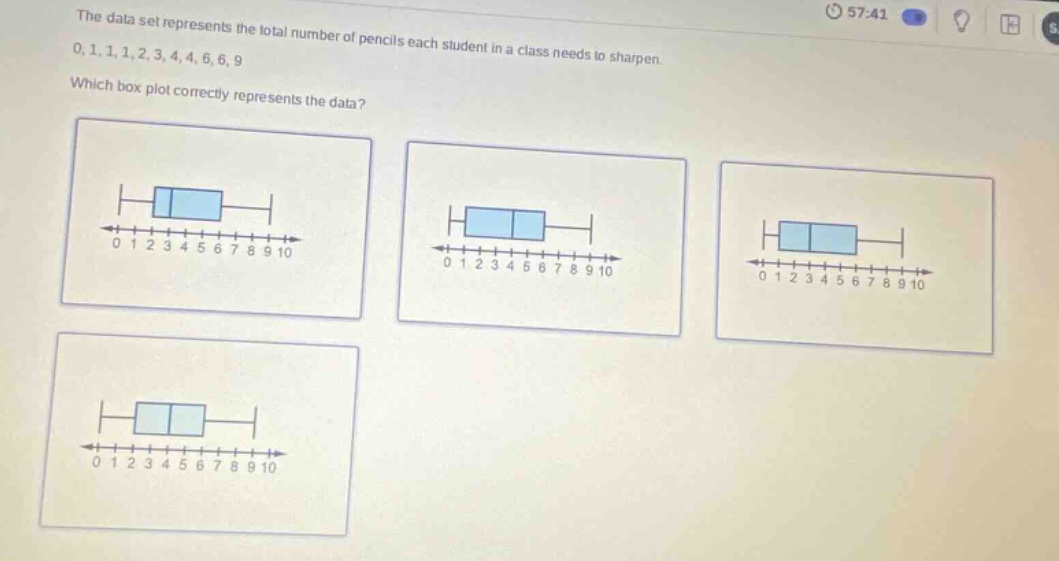
the data set represents the total number of pencils each student in a class needs to sharpen. 0,1,1,1,2,3,4,4,6,6,9 which box - plot correctly represents the data?
Answer
Explanation:
Step1: Arrange data in ascending order
$0,1,1,1,2,3,4,4,6,6,9$
Step2: Find the median (Q2)
There are 11 data - points. The median is the 6th value. So, $Q2 = 3$.
Step3: Find the lower half of data
The lower half is $0,1,1,1,2$. The median of the lower half (Q1) is 1.
Step4: Find the upper half of data
The upper half is $4,4,6,6,9$. The median of the upper half (Q3) is 6.
Step5: Identify the minimum and maximum
The minimum value is 0 and the maximum value is 9.
Answer:
The box - plot with the minimum at 0, Q1 at 1, Q2 at 3, Q3 at 6, and maximum at 9 is the correct one. (Since no options are labeled, you would match these values to the given box - plots).